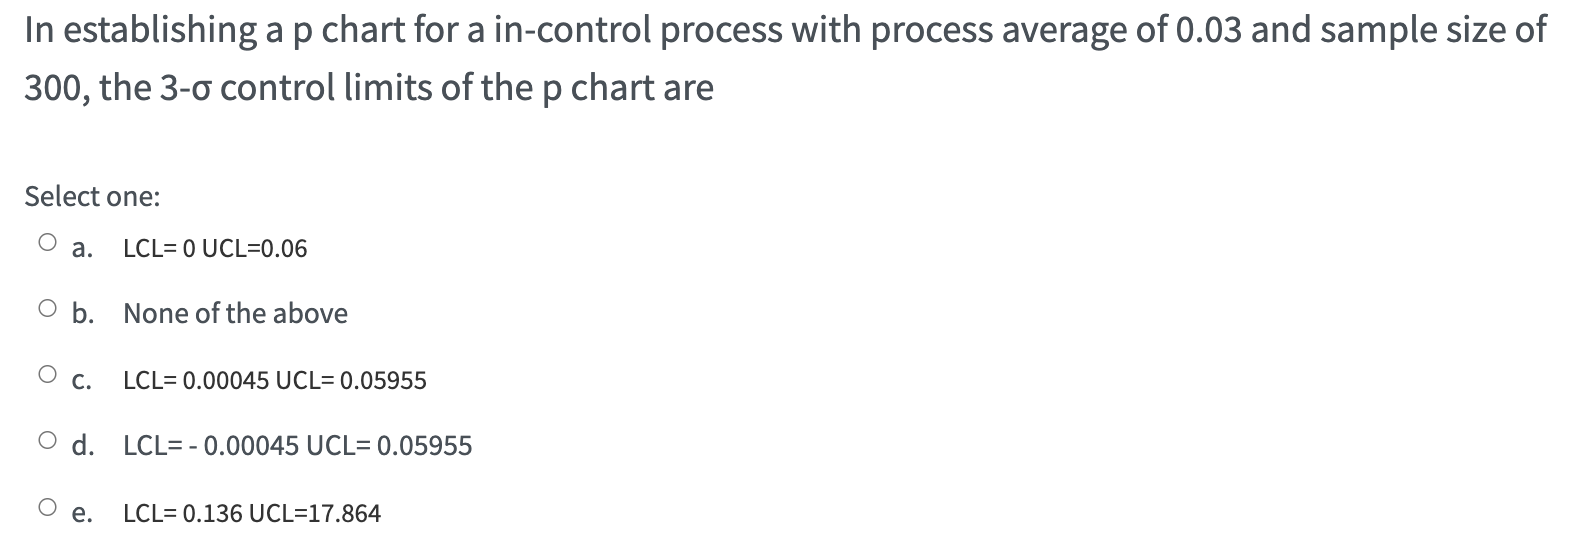
Question: In establishing a p chart for a in-control process with process average of 0.03 and sample size of 300, the 3-0 control limits of the

In establishing a p chart for a in-control

In establishing a p chart for a in-control process with process average of 0.03 and sample size of 300, the 3-0 control limits of the p chart are Select one: a. LCL= 0 UCL=0.06 O b. None of the above O c. LCL= 0.00045 UCL= 0.05955 d d. LCL= -0.00045 UCL= 0.05955 e. LCL= 0.136 UCL=17.864

Step by Step Solution

There are 3 Steps involved in it

1 Expert Approved Answer
Step: 1 Unlock blur-text-image
Question Has Been Solved by an Expert!

Get step-by-step solutions from verified subject matter experts

Step: 2 Unlock
Step: 3 Unlock

Students Have Also Explored These Related General Management Questions!