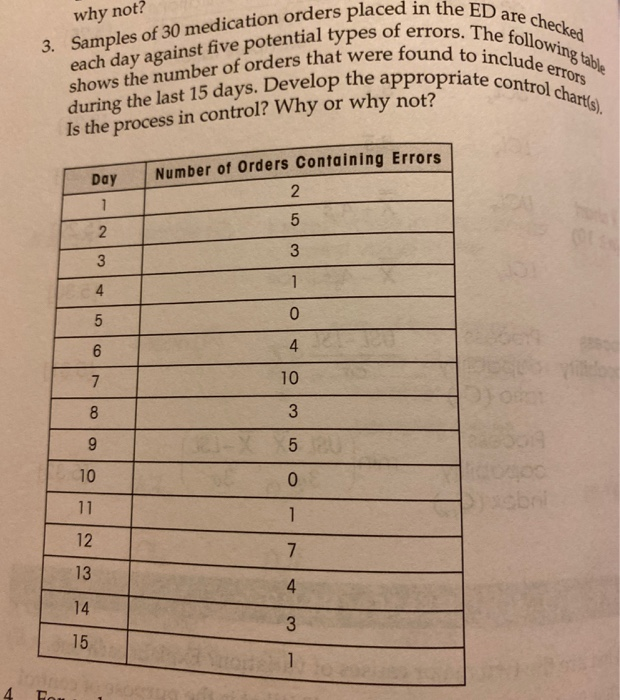
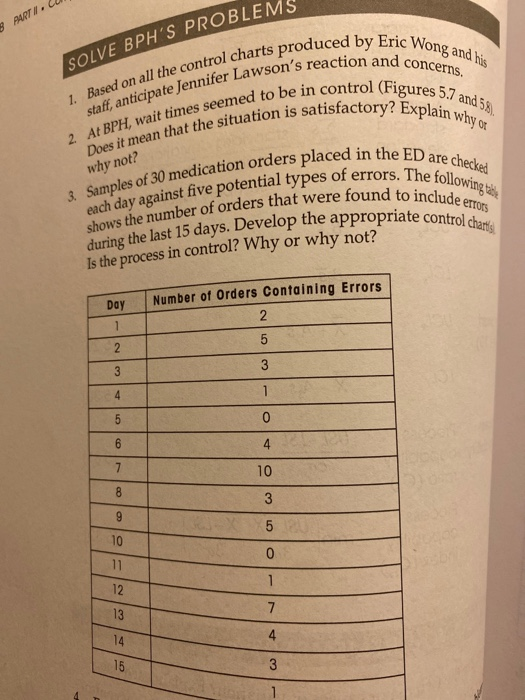
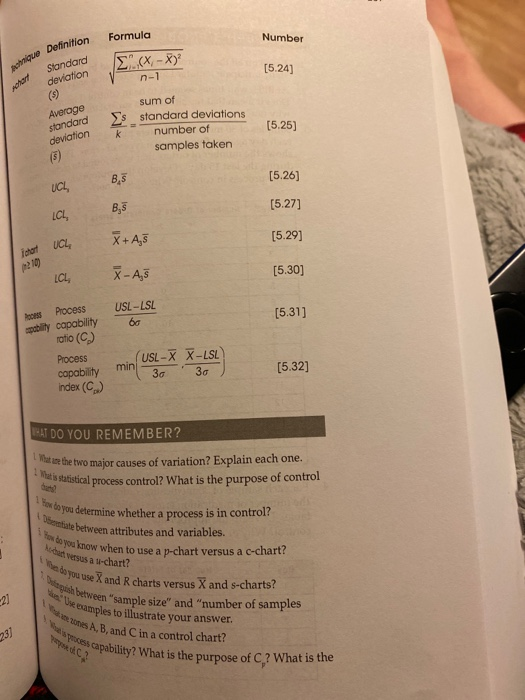
Question: Please assist with below. Please go step by step to explain process. M2-Q2 (Textbook Problem 3 Chapter 5) Sample size 30 Number of orders containing

Please assist with below. Please go step by step to explain process. Please assist with below. Please go step by step
Please assist with below. Please go step by step
M2-Q2 (Textbook Problem 3 Chapter 5) Sample size 30 Number of orders containing errors 2 Day . UCL LCL 1 5 N p-bar Sp UCL LCL 3 3 4 1 5 0 6 4 1 7 10 2 8 3 3 9 5 0 4 5 6 1 10 11 12 13 7 4 8 3 14 15 9 1 1 2 3 4 5 6 -7 8 -9 0 1 2 3. Samples of 30 medication orders placed in the ED are checked each day against five potential types of errors. The following talde Is the process in control? Why or why not? Day Number of Orders Containing Errors 2 1 5 2 3 3 1 4 0 5 6 4 10 7 8 3 9 5 10 0 11 1 12 7 13 4 14 3 15 6 1 AUT. SOLVE BPH'S PROBLEMS staff, anticipate Jennifer Lawson's reaction and concerns. Does it mean that the situation is satisfactory? Explain why or 3. Samples of 30 medication orders placed in the ED are checked each day against five potential types of errors. The following table during the last 15 days. Develop the appropriate control charts Day Number of Orders Containing Errors 2 5 2 3 3 4 0 4 7 10 8 3 9 5 10 0 1 12 13 7 14 4 15 3 Formula Number que Definition [5.24) Standard deviation (5) n-1 sum of Average standard deviation (35) s standard deviations number of samples taken [5.25) 3,5 (5.26) UCL, LCL B,5 (5.27] X+ A [5.29] ichart UCL LCL X-A [5.30) Process pobility capability USL-LSL 60 [5.31) ratio (C) Process capability min USL-X X-LSL 30 30 [5.32] index (C) HAT DO YOU REMEMBER? Whate the two major causes of variation? Explain each one. Whatissatistical process control? What is the purpose of control Fax to you determine whether a process is in control? Ostate between attributes and variables. tox do you know when to use a p-chart versus a c-chart? Wersas a ti-chart? do you use X and R charts versus X and s-charts? Spish between "sample size" and "number of samples to illustrate your answer. -21 23] YRA yoxsas capability? What is the purpose of C? What is the Number Formula Technique Definition (5.12) Mean() total number of defects total number of sets of inspected units (5.13] yn Standard deviation (5.14] U +35 UCL (5.15) u-35 LCL ( (5.16] Range (0 largest value in the sample - lowest value in the sample Rchart P Mean (R) (5.17] sum of the ranges SR across all samples K number of samples taken UCL DR (5.18) LCL D [5.19) Xchart Sample (25n39) mean() sum of sample values number of units in [5.20) sample (sample size) n Mean() sum of the sample means K number of samples taken [5.21; 5.28] UCL X+ A [5.22] LCL X-AR [5.23] STATISTICAL PROCESS CONTROL 205 Formula Number potrique Definition Standard deviation (1-7) number of items inspected in each sample (i.e. sample size) (5.2) +35 UCL (5.3) -35, LCL (5.4) Proportion defective number of nonconforming items in a sample number of items in the sample (sample size) [5.5) Adar Mean() total number of defects total number of inspection units [5.6) Standard deviation (5) [5.7] UCL +So (5.8) LCL -35. [5.9) a Number of sets of inspected units (n) number of observations in the original area of opportunity number of observations in the agreed upon set of inspected units [5.10] ber Number of detects per number of defects in the original area of opportunity number of sets of inspected units [5.11] 20 Computing on Quality PURPOSE Technique D to ou TOOLS USED IN THIS CHAPTER TYPE OF DATA Attributes TOOL pchart sample SPC chart used to track the proportion detective in a SPC chart used to track the number of defects per unit SPC chart used to track the number of defects per unit over time when the area of Attributes ochart Attributes chart Variables Rchart opportunity fluctuates SPC chart used to track sample means over time SPC chart used to track sample ranges over time SPC chart used to track sample standard deviations Variables Rchart Variables ochart schart over time Run test Attributes and variables Test used to detect patterns in a control chart divided into zones A, B, and C Metric to determine whether a process in control has a distribution narrow enough to fit within specification limits Process capability ratio Variables (an equivalent measure is available for attributes) Variables (an equivalent measure is available for Process copability index Metric to determine whether a process in control is properly centered with respect to a specified target value u-chart attributes) FORMULAS USED IN THIS CHAPTER Technique Definition Formula pchart Number Mean() total number of nonconforming items total number of items inspected (5.1)

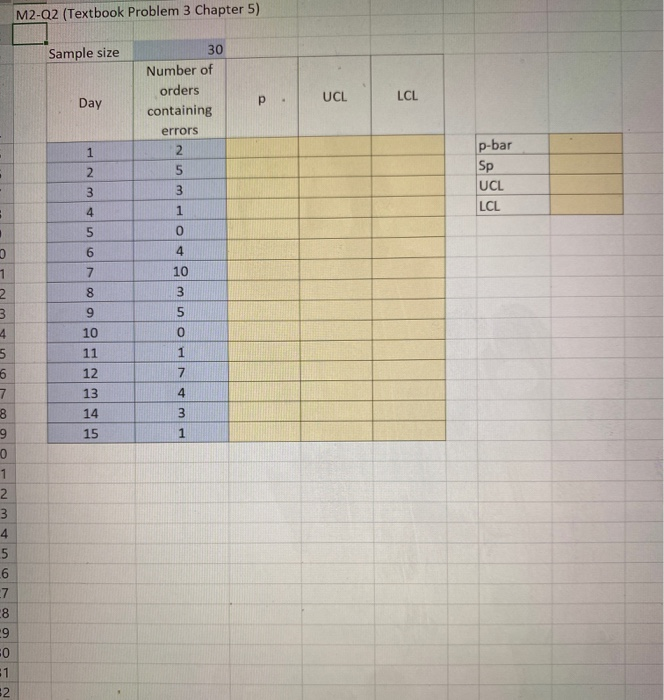
Step by Step Solution

There are 3 Steps involved in it

1 Expert Approved Answer
Step: 1 Unlock blur-text-image
Question Has Been Solved by an Expert!

Get step-by-step solutions from verified subject matter experts

Step: 2 Unlock
Step: 3 Unlock

Students Have Also Explored These Related General Management Questions!