

Question: in Excel - A mixture consisting of two components, ethanol, and water, which have boiling points of 78C and 100C, respectively. - Draw the Graph
in Excel 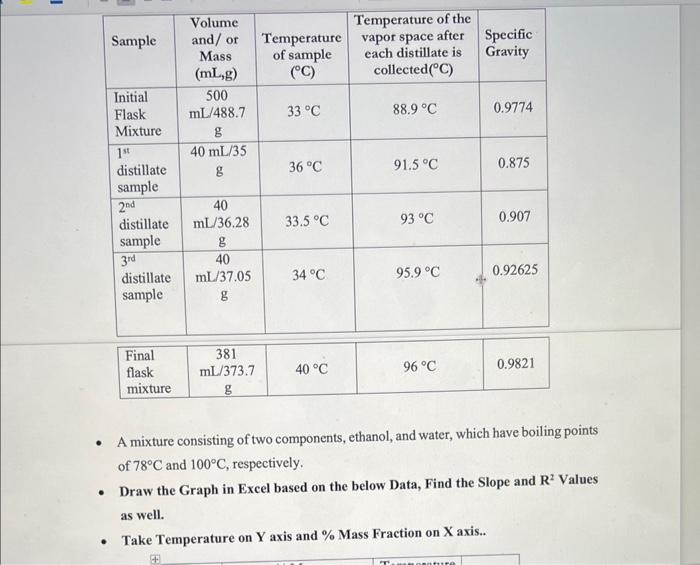
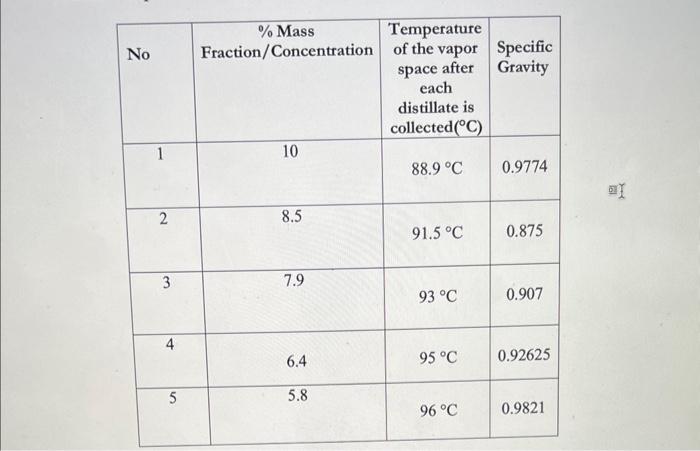
- A mixture consisting of two components, ethanol, and water, which have boiling points of 78C and 100C, respectively. - Draw the Graph in Excel based on the below Data, Find the Slope and R2 Values as well. - Take Temperature on Y axis and \% Mass Fraction on X axis.. \begin{tabular}{|c|c|c|c|} \hline No & Fraction/Concentration & Temperatureofthevaporspaceaftereach & SpecificGravitydistillateiscollected(C) \\ \hline 1 & 10 & 88.9C & 0.9774 \\ \hline 2 & 8.5 & 91.5C & 0.875 \\ \hline 3 & 7.9 & 93C & 0.907 \\ \hline 4 & 6.4 & 95C & 0.92625 \\ \hline 5 & 5.8 & 96C & 0.9821 \\ \hline \end{tabular}
Step by Step Solution
There are 3 Steps involved in it
1 Expert Approved Answer
Step: 1 Unlock

Question Has Been Solved by an Expert!
Get step-by-step solutions from verified subject matter experts
Step: 2 Unlock
Step: 3 Unlock