

Question: in excel - A mixture consisting of two components, ethanol, and water, which have boiling points of 78C and 100C, respectively. - Draw the Graph
in excel 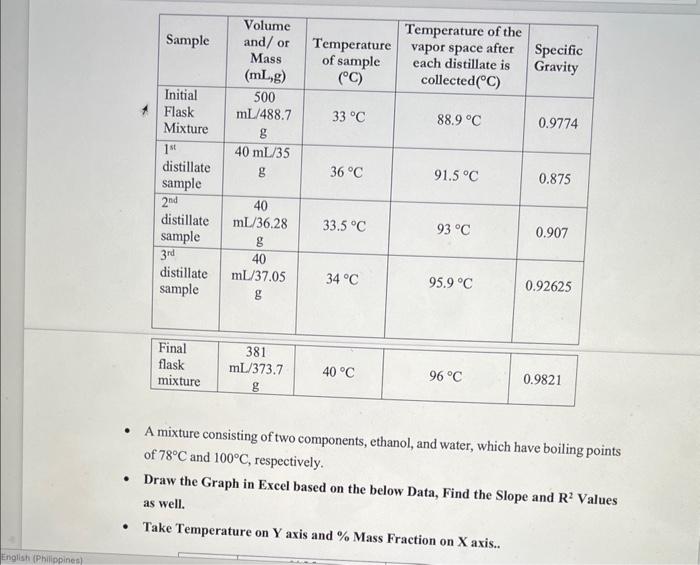
- A mixture consisting of two components, ethanol, and water, which have boiling points of 78C and 100C, respectively. - Draw the Graph in Excel based on the below Data, Find the Slope and R2 Values as well. - Take Temperature on Y axis and \% Mass Fraction on X axis.. - A mixture consisting of two components, ethanol, and water, which have boiling points of 78C and 100C, respectively. - Draw the Graph in Excel based on the below Data, Find the Slope and R2 Values as well. - Take Temperature on Y axis and \% Mass Fraction on X axis
Step by Step Solution
There are 3 Steps involved in it
1 Expert Approved Answer
Step: 1 Unlock

Question Has Been Solved by an Expert!
Get step-by-step solutions from verified subject matter experts
Step: 2 Unlock
Step: 3 Unlock