

Question: In Excel, using a line chart, plot the historical data for each of the 5 items given. What does it tell you? Using the unemployment
In Excel, using a line chart, plot the historical data for each of the items
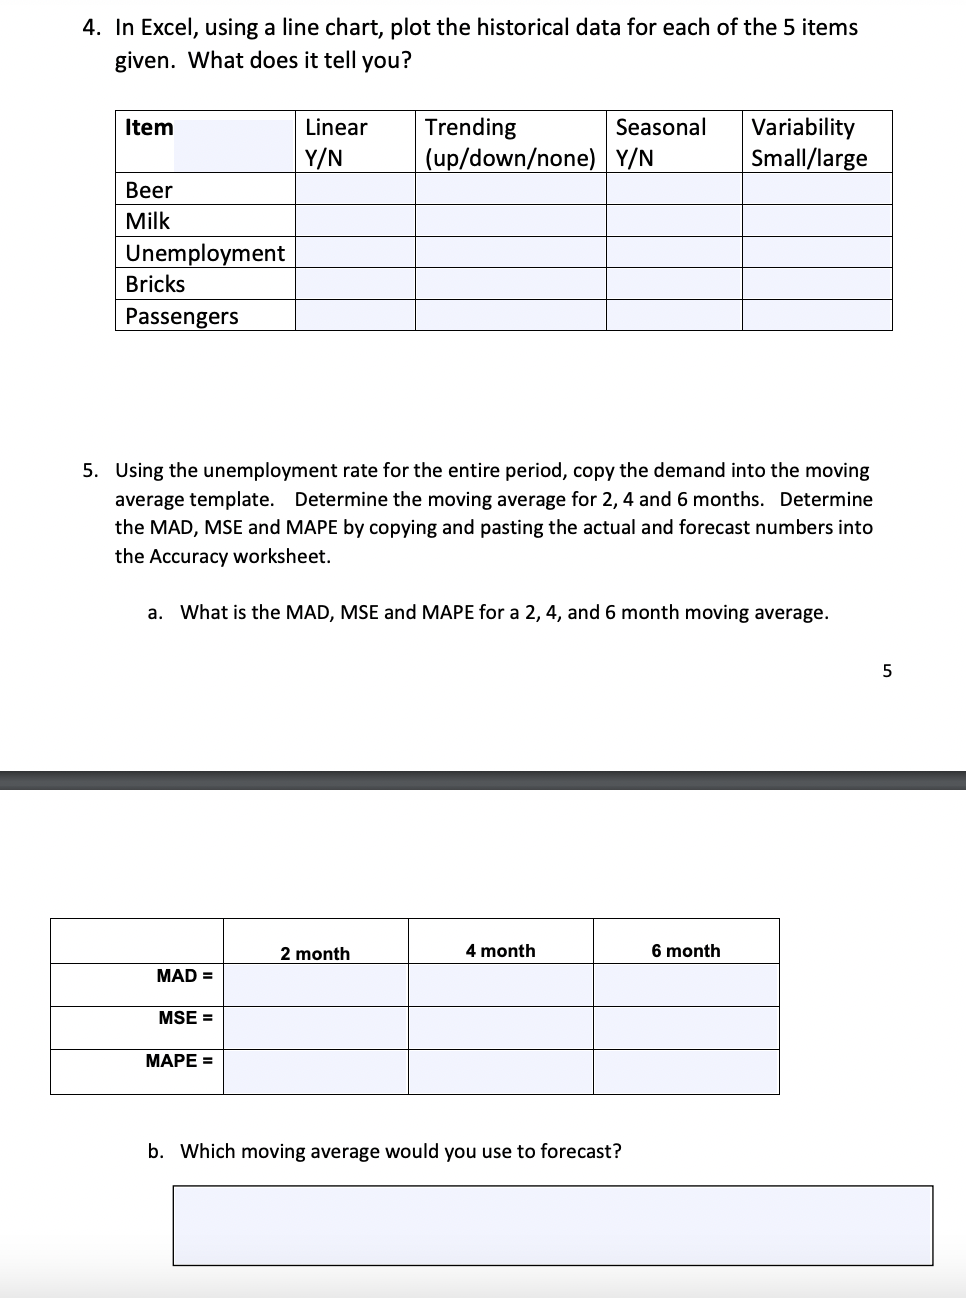
given. What does it tell you?
Using the unemployment rate for the entire period, copy the demand into the moving
average template. Determine the moving average for and months. Determine
the MAD, MSE and MAPE by copying and pasting the actual and forecast numbers into
the Accuracy worksheet.
a What is the MAD, MSE and MIMilkUnemploymentBricksPassengersAPE for a and month moving average.
b Which moving average would you use to forecast?
c What happens to the forecast accuracy when you use exponential smoothing
with an alpha of and what is the MAD, MSE and MAPE for each alpha
d Is the forecast better or worse? Which forecast would you use now?
e Determining the forecast using a weighted moving average using the weights of
and
f What happens to the forecast accuracy?
g what is the MAD, MSE and MAPE for each alpha
h What happens to the forecast accuracy when you use the linear trend model?
i What model would you recommend based on all your analysis? Why?
Step by Step Solution
There are 3 Steps involved in it
1 Expert Approved Answer
Step: 1 Unlock

Question Has Been Solved by an Expert!
Get step-by-step solutions from verified subject matter experts
Step: 2 Unlock
Step: 3 Unlock