

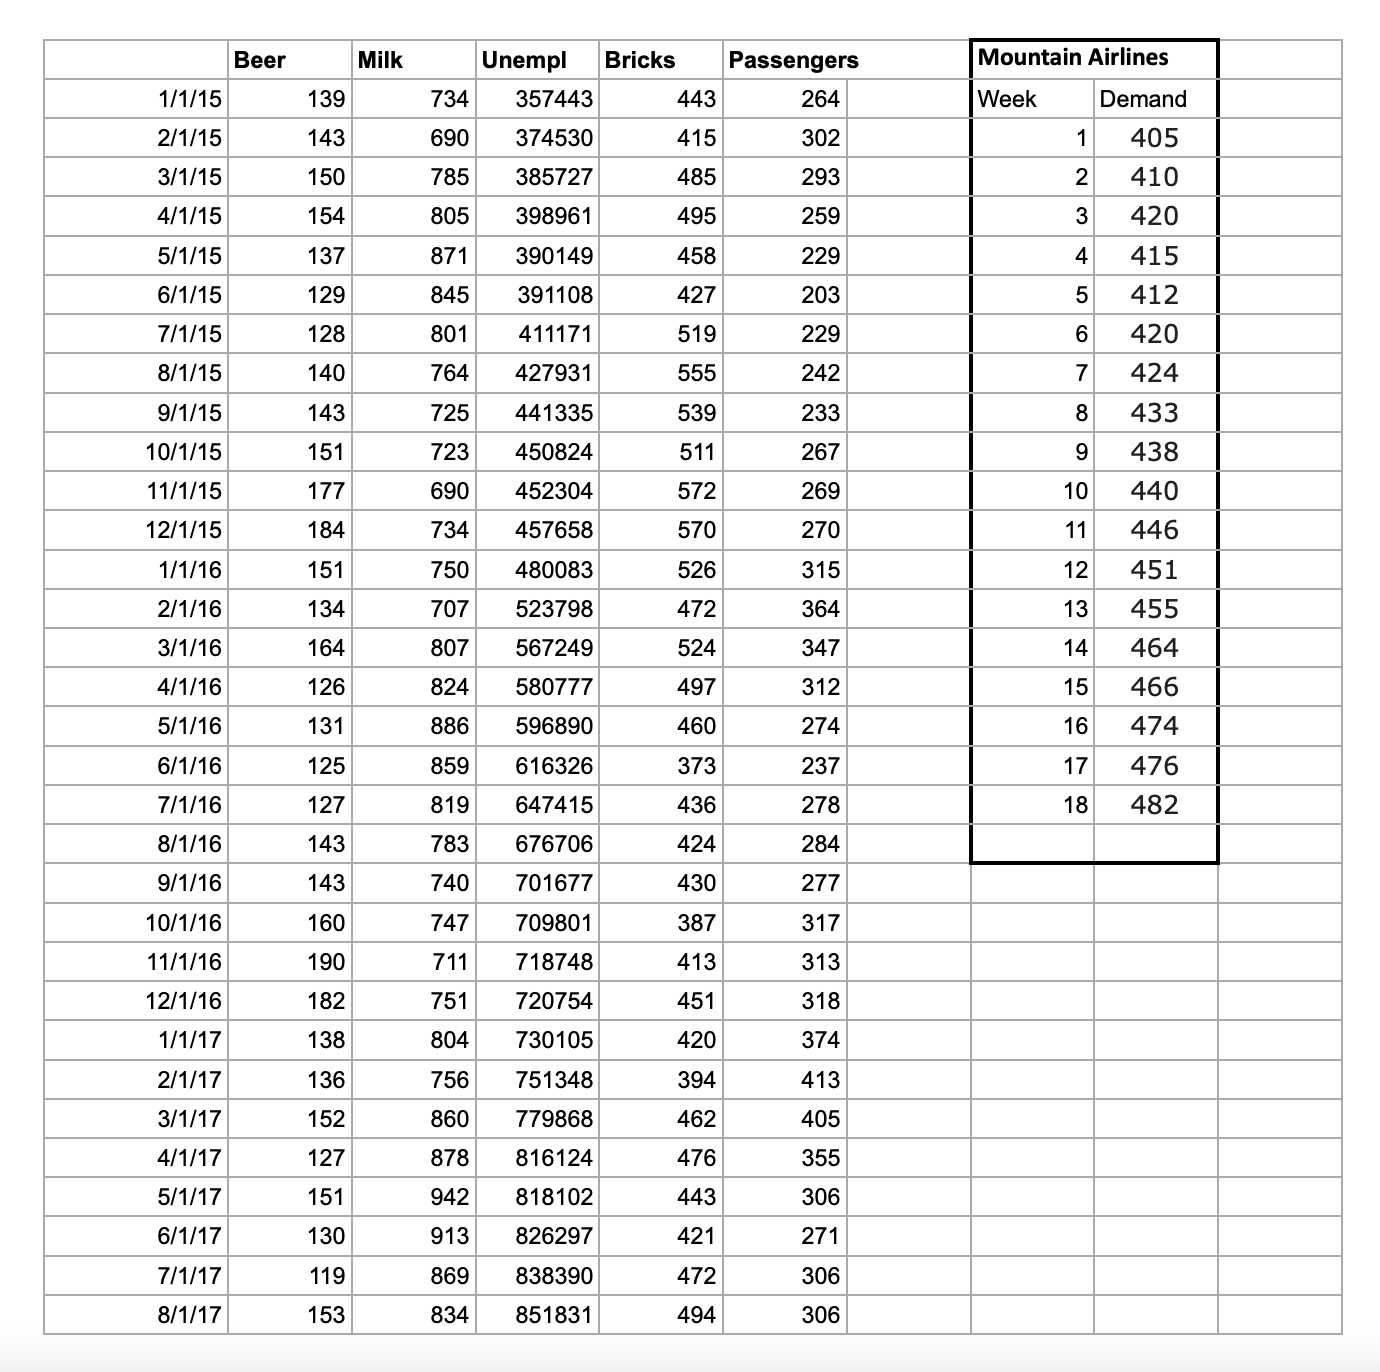
Question: In Excel, using a line chart, plot the historical data for each of the 5 items given. What does it tell you? table [
In Excel, using a line chart, plot the historical data for each of the items given. What does it tell you?
tableItemtableLinearYNtableTrendingupdownnonetableSeasonalYNtableVariabilitySmalllargeBeerMilkUnemploymentBricksPassengers
In Excel, using a line chart, plot the historical data for each of the items
given. What does it tell you?
Step by Step Solution
There are 3 Steps involved in it
1 Expert Approved Answer
Step: 1 Unlock

Question Has Been Solved by an Expert!
Get step-by-step solutions from verified subject matter experts
Step: 2 Unlock
Step: 3 Unlock