

Question: In import numpy as np import matplotlib.pyplot as pyplot Smatplotlib inline In [ ]: # Suppose that we have the 10 quiz scores for 7
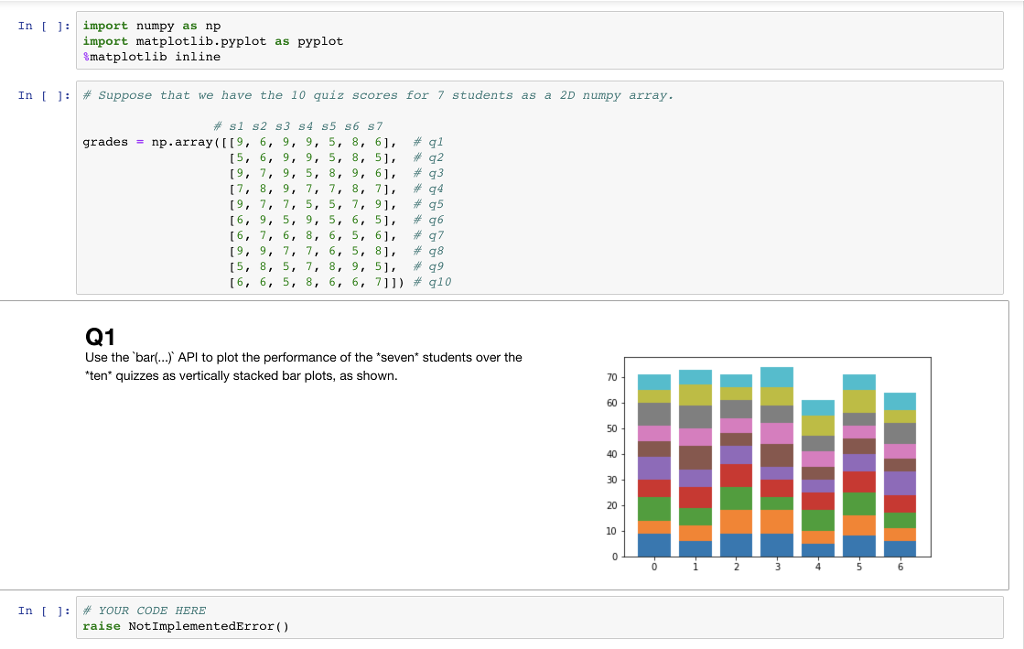
In import numpy as np import matplotlib.pyplot as pyplot Smatplotlib inline In [ ]: # Suppose that we have the 10 quiz scores for 7 students as a 2D numpy array. gradesn np.array([t9, 6, 9, 9, 5, 8, 61, #qi [5, 6, 9, 9, 5, 8, 51, g2 (9, 7, 9, 5, 8, 9, 6], #93 17, 8, 9, 7,7, 8, 71 g4 [9, 7, 7, 5, 5, 7, 9], #95 [6, 9, 5, 9, 5, 6, 5], #96 (6, 7, 6, 8, 6, 5, 6], #97 [9, 9, 7, 7, 6, 5, 8], #98 [5, 8, 5, 7, 8, 9, 51, g9 (6, 6, 5, 8, 6, 6, 7]]) #g10 Q1 Use the bar...) API to plot the performance of the "seven" students over the ten quizzes as vertically stacked bar plots, as shown. 70 60 50 40 30 20 10 In YOUR CODE HERE raise NotImplementedError ( In import numpy as np import matplotlib.pyplot as pyplot Smatplotlib inline In [ ]: # Suppose that we have the 10 quiz scores for 7 students as a 2D numpy array. gradesn np.array([t9, 6, 9, 9, 5, 8, 61, #qi [5, 6, 9, 9, 5, 8, 51, g2 (9, 7, 9, 5, 8, 9, 6], #93 17, 8, 9, 7,7, 8, 71 g4 [9, 7, 7, 5, 5, 7, 9], #95 [6, 9, 5, 9, 5, 6, 5], #96 (6, 7, 6, 8, 6, 5, 6], #97 [9, 9, 7, 7, 6, 5, 8], #98 [5, 8, 5, 7, 8, 9, 51, g9 (6, 6, 5, 8, 6, 6, 7]]) #g10 Q1 Use the bar...) API to plot the performance of the "seven" students over the ten quizzes as vertically stacked bar plots, as shown. 70 60 50 40 30 20 10 In YOUR CODE HERE raise NotImplementedError (
Step by Step Solution
There are 3 Steps involved in it

Get step-by-step solutions from verified subject matter experts