

In its annual report, WIL Athletic Supply, Inc. includes the following five-year financial summary: (Click the...
Fantastic news! We've Found the answer you've been seeking!
Question:
Transcribed Image Text:
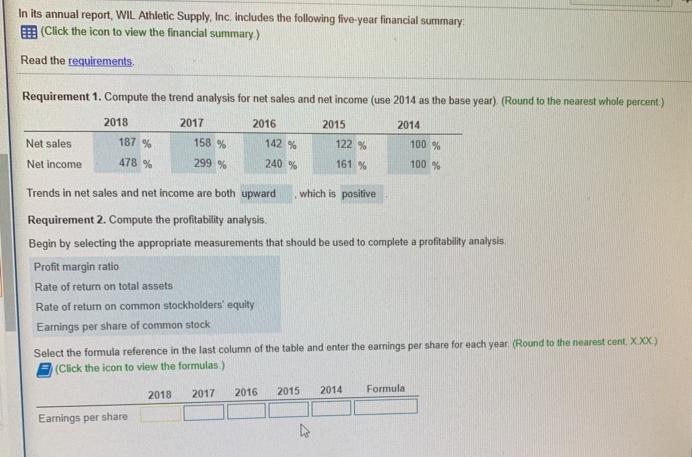
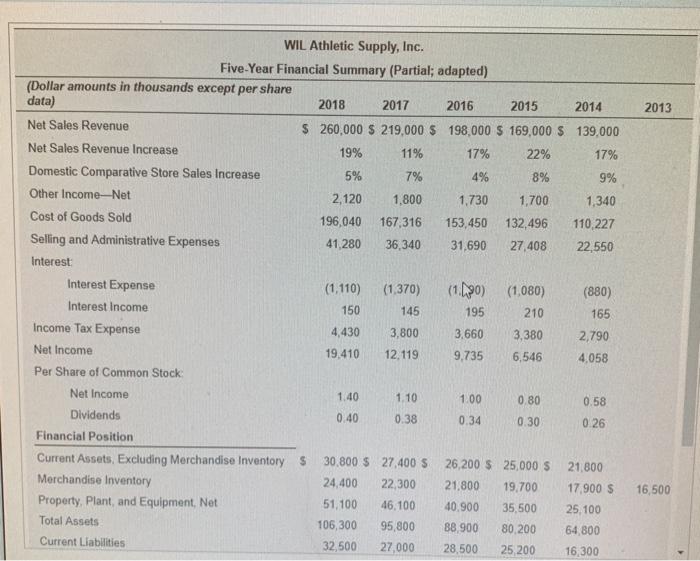
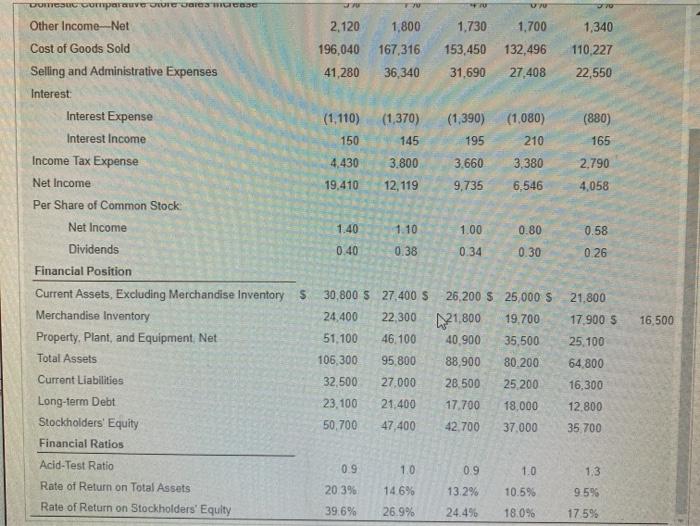
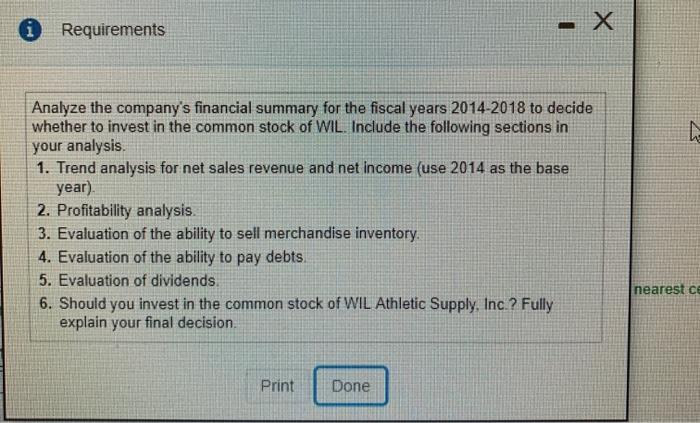
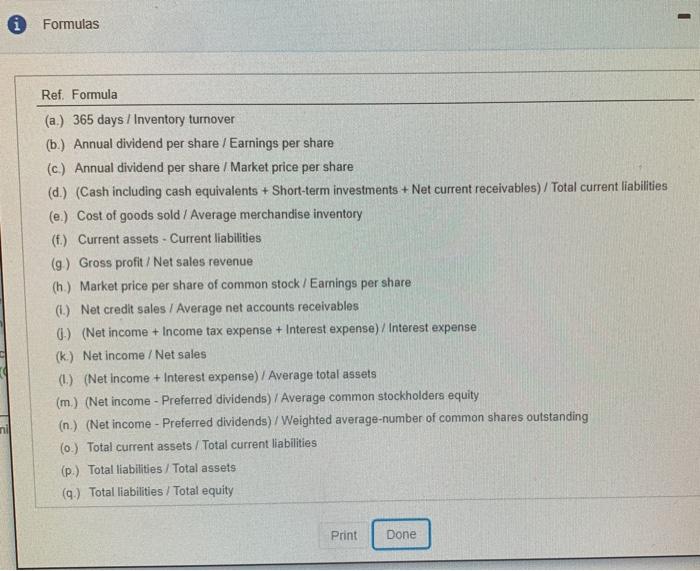
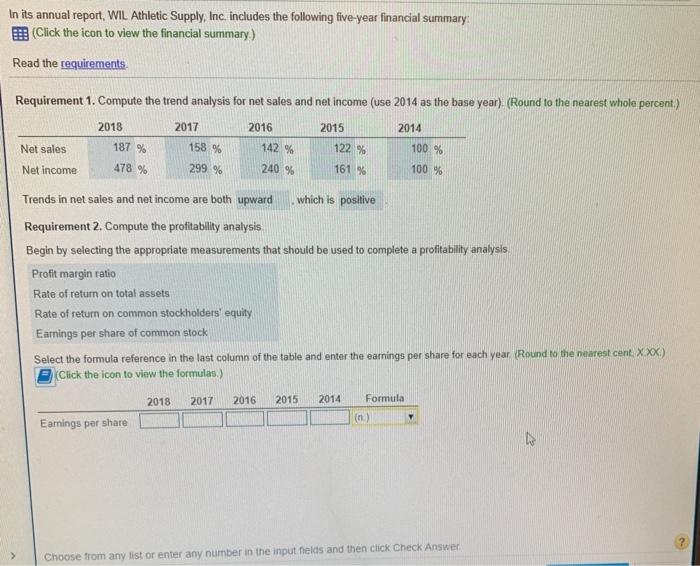
In its annual report, WIL Athletic Supply, Inc. includes the following five-year financial summary: (Click the icon to view the financial summary.) Read the requirements. Requirement 1. Compute the trend analysis for net sales and net income (use 2014 as the base year). (Round to the nearest whole percent) 2016 2014 Net sales Net income 2018 187% 478 % 2017 158 % 299 % Profit margin ratio Rate of return on total assets Rate of return on common stockholders' equity Earnings per share of common stock Earnings per share 2018 Trends in net sales and net income are both upward Requirement 2. Compute the profitability analysis. Begin by selecting the appropriate measurements that should be used to complete a profitability analysis 142 % 240 % 2017 2016 Select the formula reference in the last column of the table and enter the earnings per share for each year. (Round to the nearest cent. X.XX.) (Click the icon to view the formulas) 2015 122 % 161 % which is positive 2015 4 100 % 100 % 2014 Formula (Dollar amounts in thousands except per share data) Net Sales Revenue Net Sales Revenue Increase WIL Athletic Supply, Inc. Five-Year Financial Summary (Partial; adapted) Domestic Comparative Store Sales Increase Other Income-Net Cost of Goods Sold Selling and Administrative Expenses Interest: Interest Expense Interest Income Income Tax Expense Merchandise Inventory Property, Plant, and Equipment, Net Total Assets Current Liabilities 2018 2017 2016 2015 $ 260,000 $ 219,000 $ 198,000 $ 169,000 $ 139,000 19% 11% 17% 22% 17% 5% 7% 4% 8% 9% 2,120 1,800 1,730 1,700 196,040 167,316 153,450 132,496 41,280 36,340 31,690 27,408 Net Income Per Share of Common Stock: Net Income Dividends Financial Position Current Assets, Excluding Merchandise Inventory S (1,110) (1,370) (1.90) (1,080) 150 145 195 210 4,430 3,800 3.660 19,410 12,119 9,735 1.40 0.40 1.10 0.38 30,800 $ 27,400 S 24,400 22,300 51,100 46,100 106,300 95,800 32,500 27,000 1.00 0.34 3,380 6,546 0.80 0.30 26,200 $25,000 $ 21,800 19,700 40,900 35,500 88,900 80,200 28,500 25,200 2014 1,340 110,227 22,550 (880) 165 2,790 4,058 0.58 0.26 21,800 17,900 S 25,100 64,800 16,300 2013 16,500 Domestic Comparauveure area trase Other Income-Net Cost of Goods Sold Selling and Administrative Expenses Interest: Interest Expense Interest Income Income Tax Expense Net Income Per Share of Common Stock: Net Income Dividends Financial Position Current Assets, Excluding Merchandise Inventory S Merchandise Inventory Property, Plant, and Equipment, Net Total Assets Current Liabilities Long-term Debt Stockholders' Equity Financial Ratios Acid-Test Ratio Rate of Return on Total Assets Rate of Return on Stockholders' Equity (1,110) 150 4,430 19,410 2,120 1,800 1,340 196,040 167,316 153,450 132,496 110,227 41,280 36,340 31,690 27,408 22,550 1.40 0.40 0.9 20.3% 39.6% (1,370) (1,390) 145 195 3.800 3.660 12,119 9,735 1.10 0.38 30,800 $ 27,400 S 24,400 22,300 51,100 46,100 106,300 95,800 32,500 27,000 23,100 21,400 50,700 U 1,730 1,700 1.0 14.6% 26.9% 1.00 0.34 26,200 $ 25,000 $ 21,800 19.700 40,900 35,500 88,900 80.200 28.500 25,200 17,700 18,000 47,400 42,700 37,000 (1.080) 210 3,380 6,546 0.9 13.2% 24.4% 0.80 0.30 370 1.0 10.5% 18.0% (880) 165 2,790 4,058 0.58 0.26 21,800 17,900 S 25,100 64,800 16,300 12,800 35,700 1.3 9.5% 17.5% 16,500 Requirements Analyze the company's financial summary for the fiscal years 2014-2018 to decide whether to invest in the common stock of WIL. Include the following sections in your analysis. 1. Trend analysis for net sales revenue and net income (use 2014 as the base year). 2. Profitability analysis. 3. Evaluation of the ability to sell merchandise inventory. 4. Evaluation of the ability to pay debts. 5. Evaluation of dividends. 6. Should you invest in the common stock of WIL Athletic Supply, Inc.? Fully explain your final decision. - X Print Done ĥ nearest ce Formulas Ref. Formula (a.) 365 days / Inventory turnover (b.) Annual dividend per share / Earnings per share (c) Annual dividend per share / Market price per share (d.) (Cash including cash equivalents + Short-term investments + Net current receivables)/ Total current liabilities (e.) Cost of goods sold / Average merchandise inventory (f.) Current assets Current liabilities (g) Gross profit/ Net sales revenue (h.) Market price per share of common stock/Earnings per share. (i.) Net credit sales / Average net accounts receivables () (Net income + Income tax expense + Interest expense) / Interest expense (k.) Net income / Net sales (1.) (Net income + Interest expense) / Average total assets (m.) (Net income - Preferred dividends) / Average common stockholders equity (n.) (Net income - Preferred dividends)/ Weighted average-number of common shares outstanding (0) Total current assets/Total current liabilities (p.) Total liabilities/Total assets (q.) Total liabilities/Total equity Print Done I In its annual report, WIL Athletic Supply, Inc. includes the following five-year financial summary: (Click the icon to view the financial summary.) Read the requirements. Requirement 1. Compute the trend analysis for net sales and net income (use 2014 as the base year). (Round to the nearest whole percent.) 2016 2014 Net sales Net income 2018 187 % 478 % 2017 158 % 299 % Profit margin ratio Rate of return on total assets Rate of return on common stockholders' equity Earnings per share of common stock Earnings per share 2018 142 % 240 % 2015 Trends in net sales and net income are both upward Requirement 2. Compute the profitability analysis. Begin by selecting the appropriate measurements that should be used to complete a profitability analysis. 122 % 161 % which is positive Select the formula reference in the last column of the table and enter the earnings per share for each year. (Round to the nearest cent, XXX) Click the icon to view the formulas.) 2017 2016 2015 2014 100 % 100 % Formula (n.) Choose from any list or enter any number in the input fields and then click Check Answer 4 In its annual report, WIL Athletic Supply, Inc. includes the following five-year financial summary: (Click the icon to view the financial summary.) Read the requirements. Requirement 1. Compute the trend analysis for net sales and net income (use 2014 as the base year). (Round to the nearest whole percent) 2016 2014 Net sales Net income 2018 187% 478 % 2017 158 % 299 % Profit margin ratio Rate of return on total assets Rate of return on common stockholders' equity Earnings per share of common stock Earnings per share 2018 Trends in net sales and net income are both upward Requirement 2. Compute the profitability analysis. Begin by selecting the appropriate measurements that should be used to complete a profitability analysis 142 % 240 % 2017 2016 Select the formula reference in the last column of the table and enter the earnings per share for each year. (Round to the nearest cent. X.XX.) (Click the icon to view the formulas) 2015 122 % 161 % which is positive 2015 4 100 % 100 % 2014 Formula (Dollar amounts in thousands except per share data) Net Sales Revenue Net Sales Revenue Increase WIL Athletic Supply, Inc. Five-Year Financial Summary (Partial; adapted) Domestic Comparative Store Sales Increase Other Income-Net Cost of Goods Sold Selling and Administrative Expenses Interest: Interest Expense Interest Income Income Tax Expense Merchandise Inventory Property, Plant, and Equipment, Net Total Assets Current Liabilities 2018 2017 2016 2015 $ 260,000 $ 219,000 $ 198,000 $ 169,000 $ 139,000 19% 11% 17% 22% 17% 5% 7% 4% 8% 9% 2,120 1,800 1,730 1,700 196,040 167,316 153,450 132,496 41,280 36,340 31,690 27,408 Net Income Per Share of Common Stock: Net Income Dividends Financial Position Current Assets, Excluding Merchandise Inventory S (1,110) (1,370) (1.90) (1,080) 150 145 195 210 4,430 3,800 3.660 19,410 12,119 9,735 1.40 0.40 1.10 0.38 30,800 $ 27,400 S 24,400 22,300 51,100 46,100 106,300 95,800 32,500 27,000 1.00 0.34 3,380 6,546 0.80 0.30 26,200 $25,000 $ 21,800 19,700 40,900 35,500 88,900 80,200 28,500 25,200 2014 1,340 110,227 22,550 (880) 165 2,790 4,058 0.58 0.26 21,800 17,900 S 25,100 64,800 16,300 2013 16,500 Domestic Comparauveure area trase Other Income-Net Cost of Goods Sold Selling and Administrative Expenses Interest: Interest Expense Interest Income Income Tax Expense Net Income Per Share of Common Stock: Net Income Dividends Financial Position Current Assets, Excluding Merchandise Inventory S Merchandise Inventory Property, Plant, and Equipment, Net Total Assets Current Liabilities Long-term Debt Stockholders' Equity Financial Ratios Acid-Test Ratio Rate of Return on Total Assets Rate of Return on Stockholders' Equity (1,110) 150 4,430 19,410 2,120 1,800 1,340 196,040 167,316 153,450 132,496 110,227 41,280 36,340 31,690 27,408 22,550 1.40 0.40 0.9 20.3% 39.6% (1,370) (1,390) 145 195 3.800 3.660 12,119 9,735 1.10 0.38 30,800 $ 27,400 S 24,400 22,300 51,100 46,100 106,300 95,800 32,500 27,000 23,100 21,400 50,700 U 1,730 1,700 1.0 14.6% 26.9% 1.00 0.34 26,200 $ 25,000 $ 21,800 19.700 40,900 35,500 88,900 80.200 28.500 25,200 17,700 18,000 47,400 42,700 37,000 (1.080) 210 3,380 6,546 0.9 13.2% 24.4% 0.80 0.30 370 1.0 10.5% 18.0% (880) 165 2,790 4,058 0.58 0.26 21,800 17,900 S 25,100 64,800 16,300 12,800 35,700 1.3 9.5% 17.5% 16,500 Requirements Analyze the company's financial summary for the fiscal years 2014-2018 to decide whether to invest in the common stock of WIL. Include the following sections in your analysis. 1. Trend analysis for net sales revenue and net income (use 2014 as the base year). 2. Profitability analysis. 3. Evaluation of the ability to sell merchandise inventory. 4. Evaluation of the ability to pay debts. 5. Evaluation of dividends. 6. Should you invest in the common stock of WIL Athletic Supply, Inc.? Fully explain your final decision. - X Print Done ĥ nearest ce Formulas Ref. Formula (a.) 365 days / Inventory turnover (b.) Annual dividend per share / Earnings per share (c) Annual dividend per share / Market price per share (d.) (Cash including cash equivalents + Short-term investments + Net current receivables)/ Total current liabilities (e.) Cost of goods sold / Average merchandise inventory (f.) Current assets Current liabilities (g) Gross profit/ Net sales revenue (h.) Market price per share of common stock/Earnings per share. (i.) Net credit sales / Average net accounts receivables () (Net income + Income tax expense + Interest expense) / Interest expense (k.) Net income / Net sales (1.) (Net income + Interest expense) / Average total assets (m.) (Net income - Preferred dividends) / Average common stockholders equity (n.) (Net income - Preferred dividends)/ Weighted average-number of common shares outstanding (0) Total current assets/Total current liabilities (p.) Total liabilities/Total assets (q.) Total liabilities/Total equity Print Done I In its annual report, WIL Athletic Supply, Inc. includes the following five-year financial summary: (Click the icon to view the financial summary.) Read the requirements. Requirement 1. Compute the trend analysis for net sales and net income (use 2014 as the base year). (Round to the nearest whole percent.) 2016 2014 Net sales Net income 2018 187 % 478 % 2017 158 % 299 % Profit margin ratio Rate of return on total assets Rate of return on common stockholders' equity Earnings per share of common stock Earnings per share 2018 142 % 240 % 2015 Trends in net sales and net income are both upward Requirement 2. Compute the profitability analysis. Begin by selecting the appropriate measurements that should be used to complete a profitability analysis. 122 % 161 % which is positive Select the formula reference in the last column of the table and enter the earnings per share for each year. (Round to the nearest cent, XXX) Click the icon to view the formulas.) 2017 2016 2015 2014 100 % 100 % Formula (n.) Choose from any list or enter any number in the input fields and then click Check Answer 4
Expert Answer:
Answer rating: 100% (QA)
Answer Part 1 Net Sales Trend 204 168 152 132 100 Net Income Trend 960 625 486 356 100 year 2018 2017 2016 2015 2014 Net Sales 265000 218000 198000 171000 130000 Net Sales Trend 204 168 152 132 100 Ne... View the full answer

Related Book For 

Financial and Managerial Accounting
ISBN: 978-0132497978
3rd Edition
Authors: Horngren, Harrison, Oliver
Posted Date:
Students also viewed these accounting questions
-
The T'Pring Company is considering a project that would cost $14,000 and generate the following cash flows: Year 1 $3,000 Year 2 $4,000 Year 3 $5,000 Year 4 $7,000 Assuming an interest rate of two...
-
A central warehouse purchases products for $1,358,695.65 per year. Inventory carrying costs are calculated at 25% of the average value of inventory, and the cost of placing each order has been set at...
-
Let x be a Banach space and let = be a closed. subspace of X. PT the qualient space X/E is a Banach space.
-
In Problems 1158, perform the indicated operation, and write each expression in the standard form a + bi. 6i 3 - 4i 5
-
Weyman Z. Wannamaker is the chief financial officer of Cogburn Company. He prides himself on being able to manage the companys cash resources to minimize the interest expense. Consequently, on the...
-
In the foreword to Contestable Markets and the Theory of Industrial Structure published in 1982, Elizabeth Bailey noted: The notion of contestable markets offers a generalization of the notion of...
-
Water flows from the pipe shown in Fig. P3.117 as a free jet and strikes a circular flat plate. The flow geometry shown is axisymmetrical. Determine the flowrate and the manometer reading, \(H\)....
-
Par Corporation acquired an 80 percent interest in Sin Corporation on January 1, 2011, for $108,000 cash, when Sin's capital stock was $100,000 and retained earnings were $10,000. The difference...
-
Find a general solution to the given Cauchy-Euler equation for t> 0. at dy +21-6y=0 dt- The general solution is y(t) = .
-
An acetoneethanol mixture of 0.5 mole fraction acetone is to be separated by batch distillation at 101 kPa. Vaporliquid equilibrium data at 101 kPa are as follows: (a) Assuming an L=D of 1.5 times...
-
Let <3,-2,1 >, < 2,-4,-3>, and W = < -1,2,2 >. a) (3 pts) Determine a unit vector perpendicular to both and w. b) (3 pts) Find the volume of the solid whose edges are u, , and w. c) (2 pts) Find the...
-
Show how to compute the DFT of four real, even, length- \(N\) sequences using only one length- \(N\) transform, using the results of Exercise 3.9. Exercise 3.9 Show how to compute the DFT of two even...
-
Show that: (a) The DCT of a length- \(N\) sequence \(x(n)\) corresponds to the Fourier transform of the length- \(2 N\) sequence \(\tilde{x}(n)\) consisting of \(x(n)\) extended symmetrically; that...
-
Show that the discrete cosine transform of a length- \(N\) sequence \(x(n)\) can be computed from the length \(N\) DFT of a sequence \(\hat{x}(n)\) consisting of the following reordering of the even...
-
Linear convolution using \(\mathrm{f} f t\) in MATLAB. (a) Use the \(\mathrm{fft}\) command to determine the linear convolution between two given signals \(x(n)\) and \(h(n)\). (b) Compare the...
-
Family formation patterns in New Zealand have changed over the time frame covered by the survey. New Zealand society has become more accepting of couples co-habiting (living together before or...
-
1. Write a C Program to create a child process using fork() system call, display parent and child process id. Parent process should wait for child to terminate. The output should be similar to the...
-
A sample statistic will not change from sample to sample. Determine whether the statement is true or false. If it is false, rewrite it as a true statement.
-
Each group should identify one public companys product that it wishes to evaluate. The team should gather all the information it can about the product. Requirement 1. Develop a list of key...
-
Smith Petroleum has spent $204,000 to refine 62,000 gallons of petroleum distillate, which can be sold for $6.40 a gallon. Alternatively, Smith can process the distillate further and produce 56,000...
-
Kenneth Dolkart Optical Dispensary purchased supplies on account for $3,400. Two weeks later, the business paid half on account. Requirements 1. Journalize the two transactions for Kenneth Dolkart...
-
A crystal sample of bacteriorhodpsin, a light-sensitive protein found in halobacteria that responds to light energy, has crystal planes separated by 0.20 nm. If a beam of 11 keV x rays illuminates a...
-
A nickel crystals work function is measured to be 5.22 eV at 25C. As the temperature increases by 300C, the work function drops by 50 meV. By how much does this shift the threshold wavelength for...
-
Investigators have created structures consisting of linear chains of ionized atoms on a smooth surface. Electrons are restricted to travel along the chain. The energy levels of the electrons match...

Study smarter with the SolutionInn App