

Question: In Lab 7 . 2 Excel, Descriptive Analytics: Using a Pivot Table to Analyze Historical Performance by Product Size and Year, you created the following
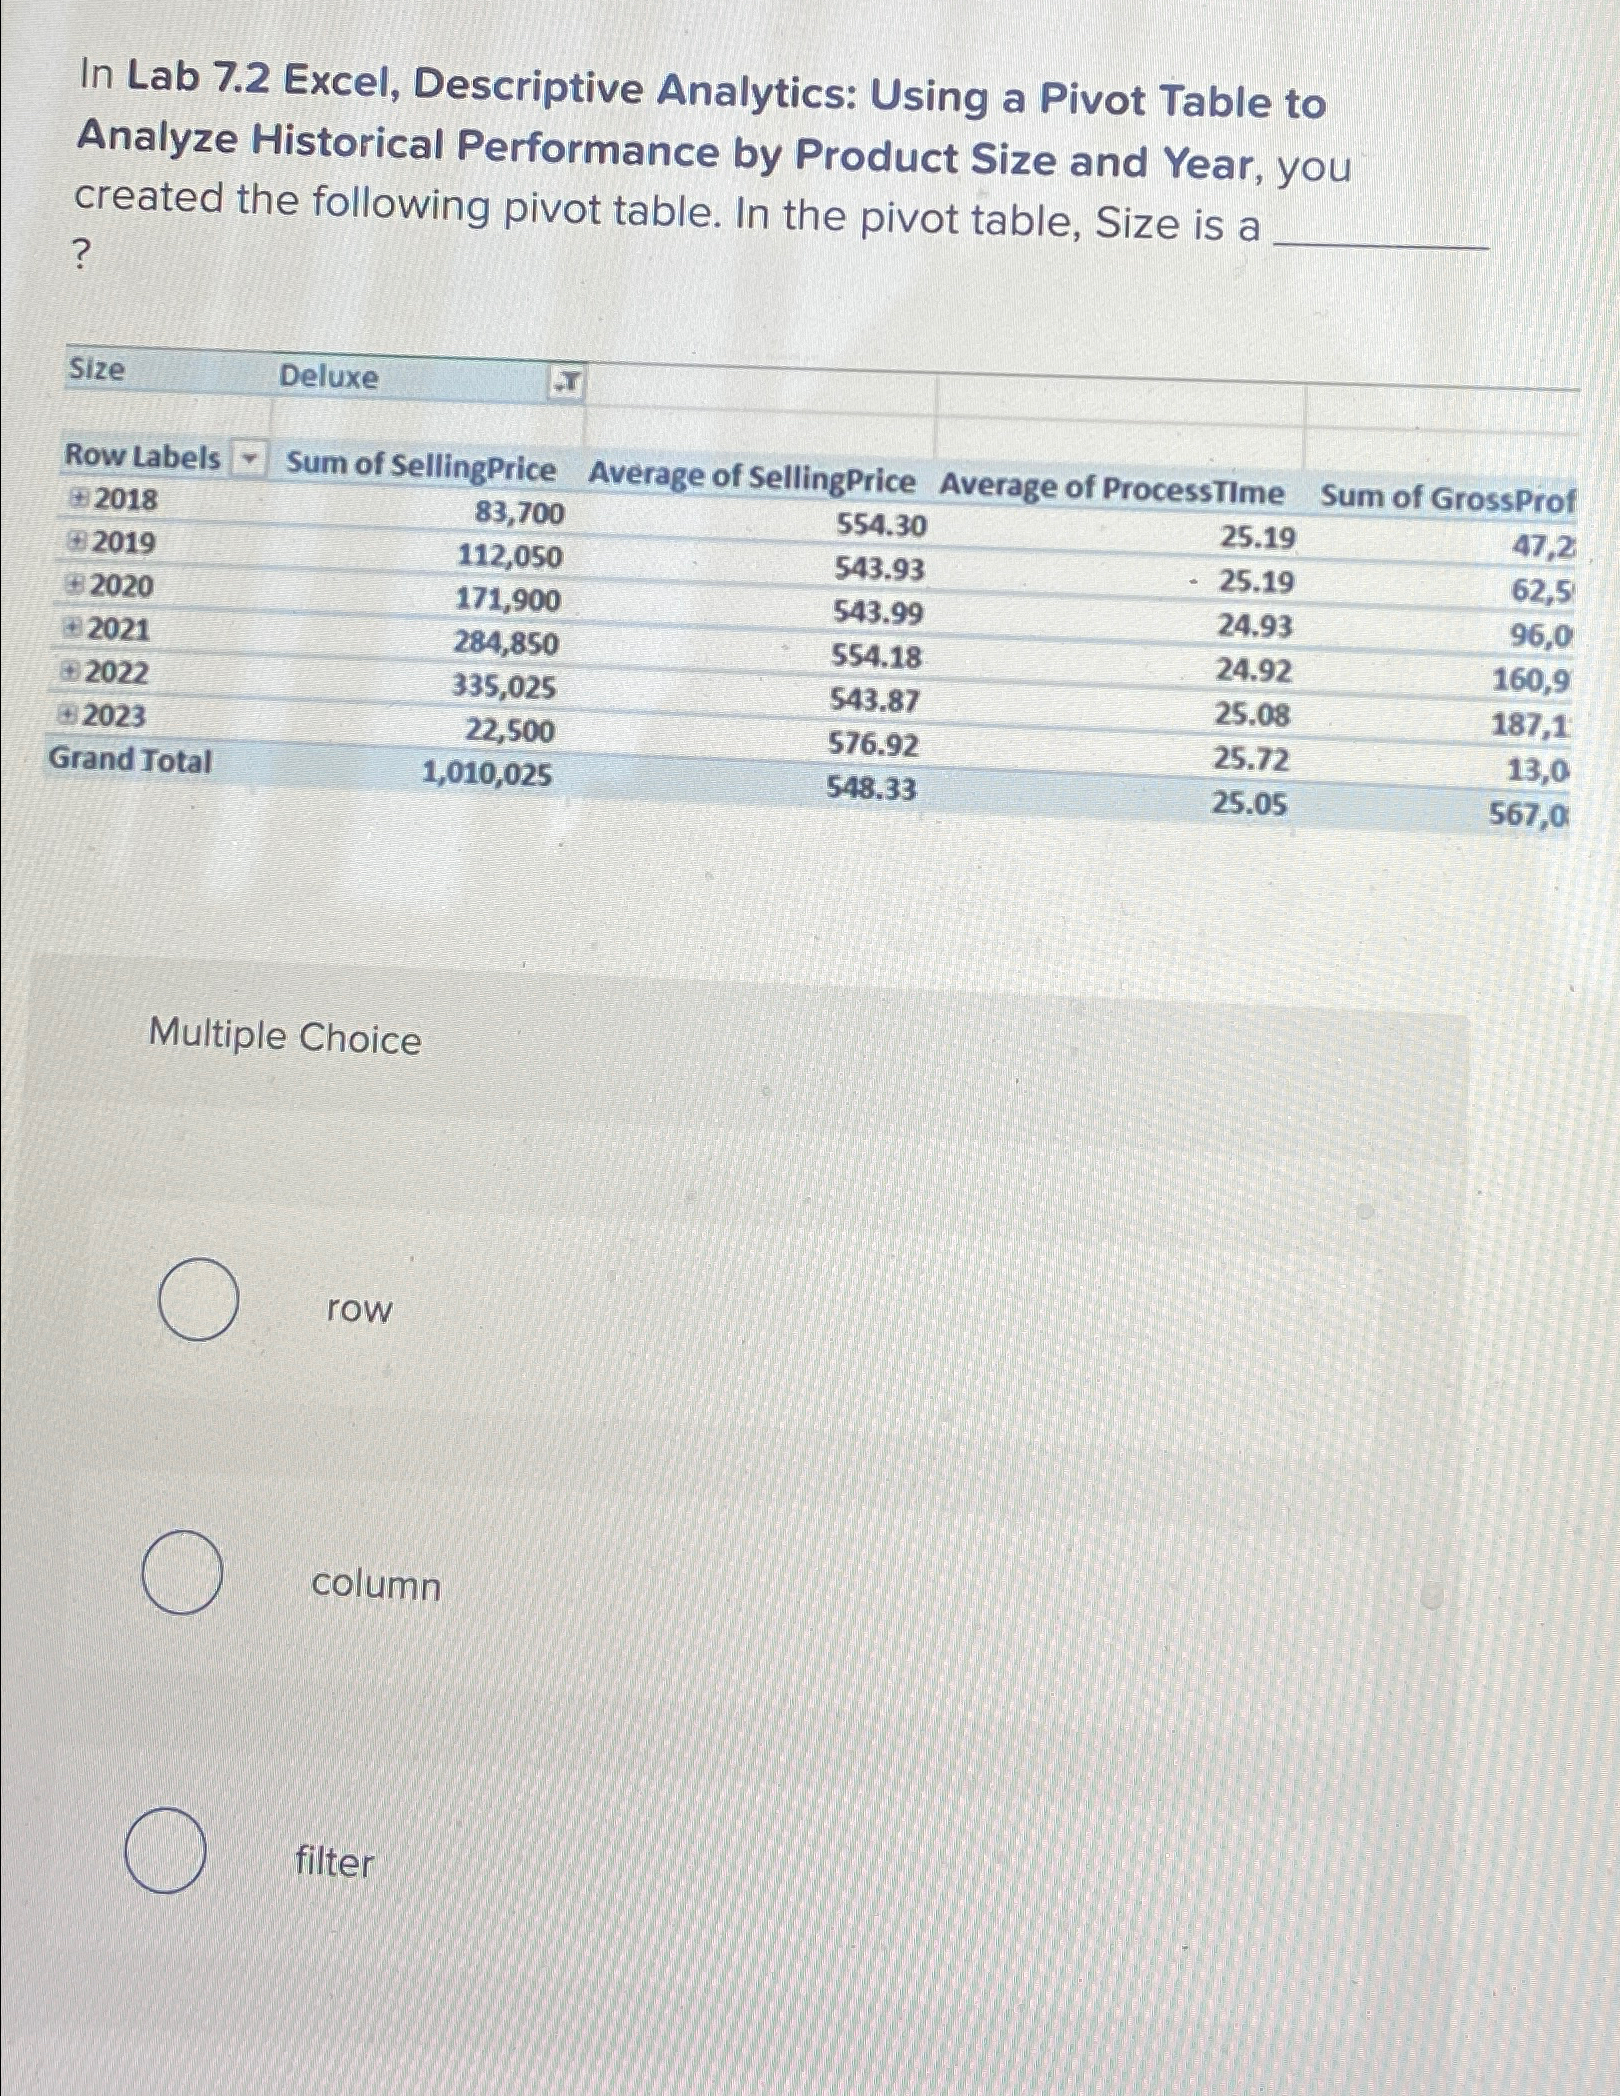
In Lab Excel, Descriptive Analytics: Using a Pivot Table to Analyze Historical Performance by Product Size and Year, you created the following pivot table. In the pivot table, Size is a
tableSizeDeluxe,,,Row Labels Sum of SellingPrice,Average of SellingPrice,Average of Processtime,Sum of GrossProfGrand Total,
Multiple Choice
row
column
filter
Step by Step Solution
There are 3 Steps involved in it
1 Expert Approved Answer
Step: 1 Unlock

Question Has Been Solved by an Expert!
Get step-by-step solutions from verified subject matter experts
Step: 2 Unlock
Step: 3 Unlock