

Question: In Lecture 2 0 , the instructor described how the chemical composition of the highestenergy cosmic rays may be inferred by studying the distribution of
In Lecture the instructor described how the chemical composition of the highestenergy cosmic rays may be inferred by studying the distribution of airshower depths in the atmosphere. In PHYS terms, if we consider the depth in the atmosphere of "shower maximum" or as an IIDRV, that IIDRV will depend parametrically on the atomic masses of the primary cosmic rays. For our final project, we will examine data from actual cosmic ray events collected by the HighResolutionFlysEye HiRes observatory, by comparing the empirical PDFs with those of simulated events.
Links to the data and simulated data required for this analysis are given below. Each file contains four columns, which contain respectively:
An integer index for each event.
The energy of each event, in units of ExaelectronVolts or EeV. One EeV electronVolts.
The depth of of each event, in units of grams
A histogramming weight to be applied to each event. For the data, each event has weight Simulated events have weights This is necessitated by the need to generate events efficiently despite cosmic radiation having a flux that rapidly falls with energy.
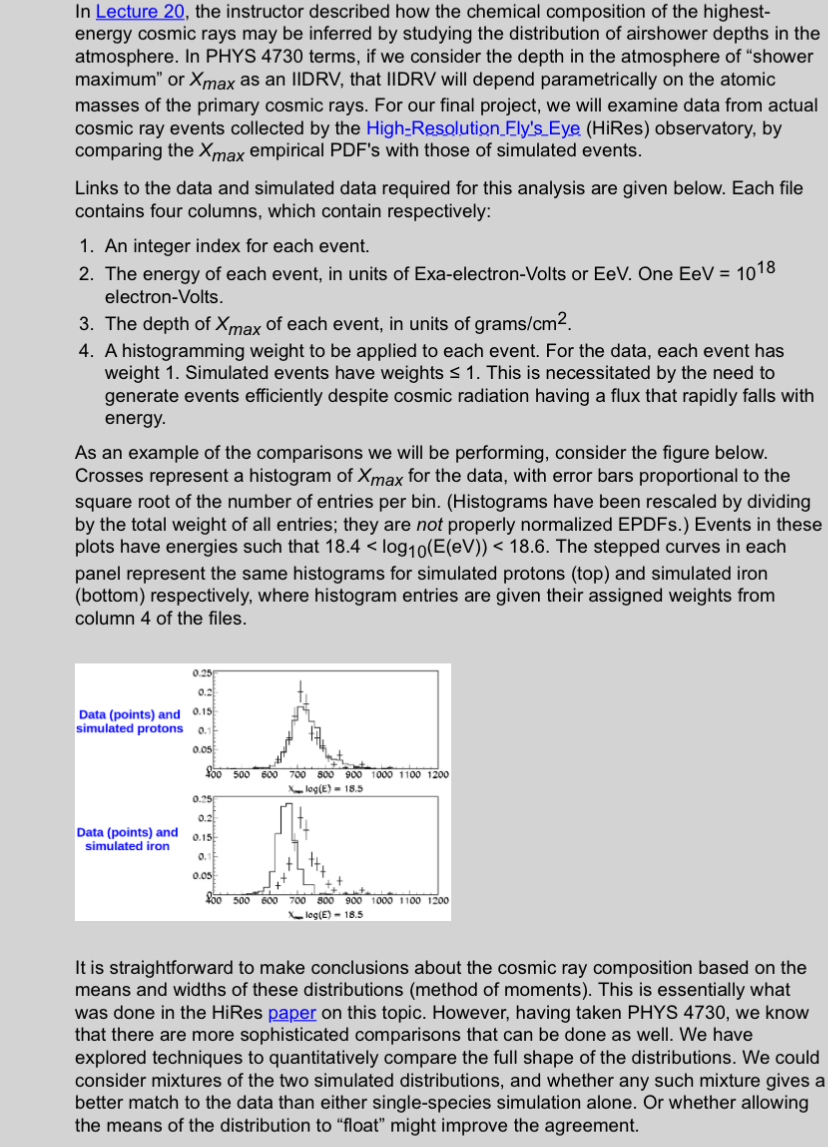
As an example of the comparisons we will be performing, consider the figure below. Crosses represent a histogram of for the data, with error bars proportional to the square root of the number of entries per bin. Histograms have been rescaled by dividing by the total weight of all entries; they are not properly normalized EPDFs. Events in these plots have energies such that The stepped curves each panel represent the same histograms for simulated protons and simulated iron respectively, where histogram entries are given their assigned weights from column the files.
straightforward make conclusions about the ray composition based the means and widths these distributions moments This essentially what was done the HiRes paper this topic. However, having taken know that there are more sophisticated comparisons that can done well. have explored techniques quantitatively compare the full shape the distributions. could consider mixtures the two simulated distributions, and whether any such mixture gives a better match the data than either singlespecies simulation alone. whether allowing the means the distribution "float" might improve the agreement.
PYTHON SCRIPT with plots and values
Step by Step Solution
There are 3 Steps involved in it
1 Expert Approved Answer
Step: 1 Unlock

Question Has Been Solved by an Expert!
Get step-by-step solutions from verified subject matter experts
Step: 2 Unlock
Step: 3 Unlock