

In looking at the information below in the balance sheet and income statement for quarter ending 10/3/2021
Fantastic news! We've Found the answer you've been seeking!
Question:
In looking at the information below in the balance sheet and income statement for quarter ending 10/3/2021 (3rd quarter), how do I determine the Price Earnings Ratio and Return on Equity?
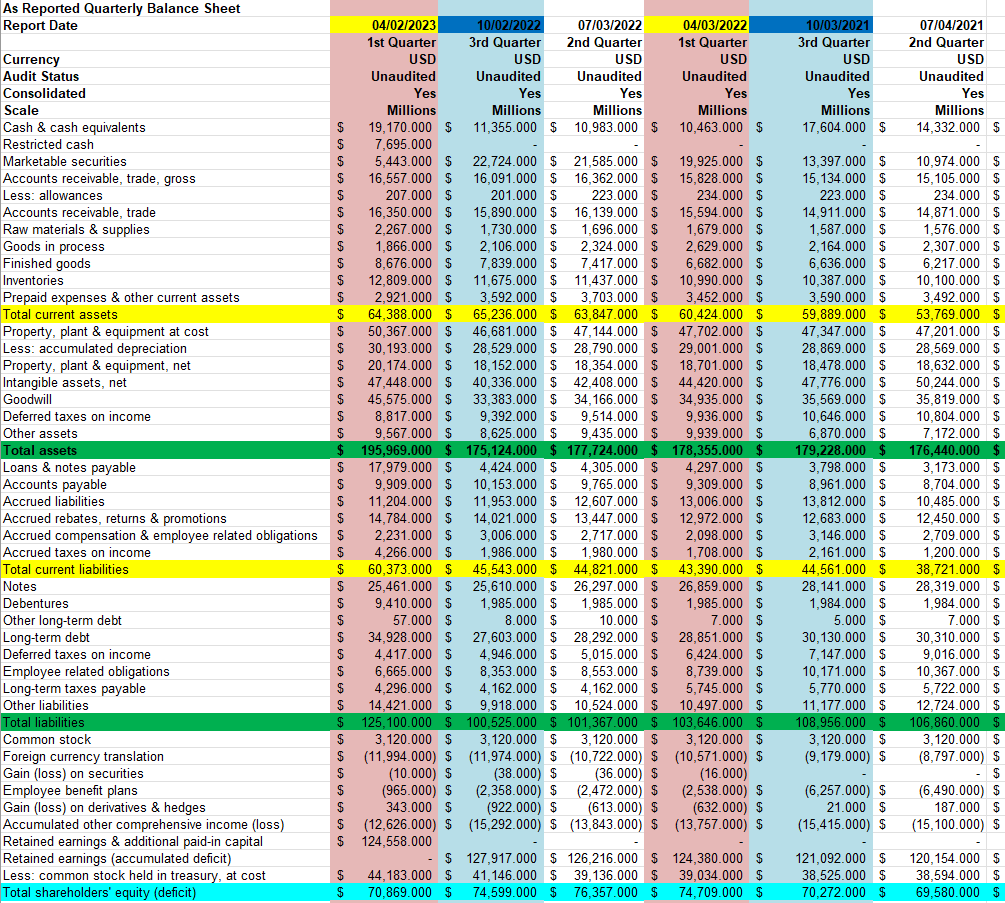
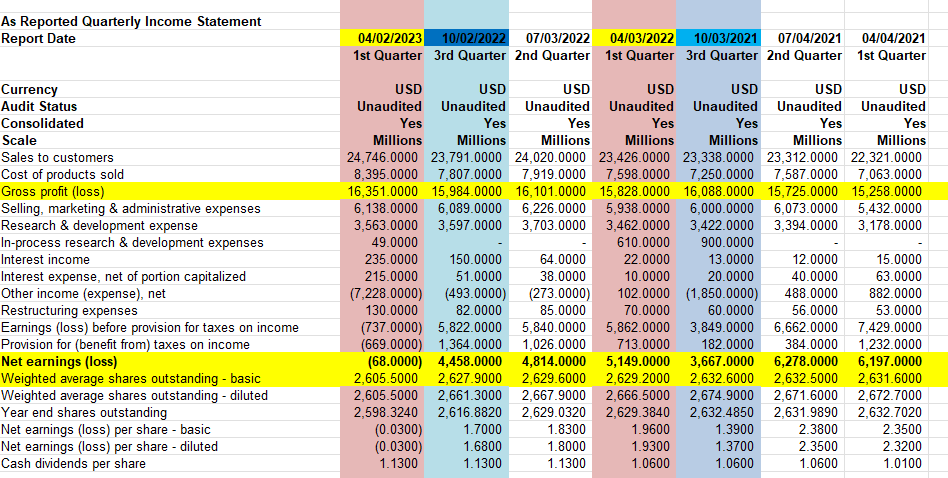
Transcribed Image Text:
As Reported Quarterly Balance Sheet Report Date Currency Audit Status Consolidated Scale Cash & cash equivalents Restricted cash Marketable securities Accounts receivable, trade, gross Less: allowances Accounts receivable, trade Raw materials & supplies Goods in process Finished goods Inventories Prepaid expenses & other current assets Total current assets Property, plant & equipment at cost Less: accumulated depreciation Property, plant & equipment, net Intangible assets, net Goodwill Deferred taxes on income Other assets Total assets Loans & notes payable Accounts payable Accrued liabilities Accrued rebates, returns & promotions Accrued compensation & employee related obligations Accrued taxes on income Total current liabilities Notes Debentures Other long-term debt Long-term debt Deferred taxes on income Employee related obligations Long-term taxes payable Other liabilities Total liabilities Common stock Foreign currency translation Gain (loss) on securities Employee benefit plans Gain (loss) on derivatives & hedges Accumulated other comprehensive income (loss) Retained earnings & additional paid-in capital Retained earnings (accumulated deficit) Less: common stock held in treasury, at cost Total shareholders' equity (deficit) $ $ $ $ $ $ $ $ $ $ $ $ $ $ $ $ $ $ $ $ $ $ $ $ 04/02/2023 1st Quarter USD Unaudited Yes Millions 19,170.000 $ 7,695.000 5,443.000 $ 16,557.000 $ 207.000 $ 16,350.000 $ 2,267.000 $ 1,866.000 $ 8,676.000 $ 12,809.000 $ 2,921.000 $ 64,388.000 $ 50,367.000 $ 30,193.000 $ 20,174.000 $ 47,448.000 $ 45,575.000 $ 8,817.000 9,567.000 $ 195,969.000 $ 17,979.000 $ 9,909.000 $ 11,204.000 $ 14,784.000 $ 2,231.000 $ 4,266.000 $ 60,373.000 $ 25,461.000 $ 9,410.000 $ 57.000 $ 34,928.000 $ 4,417.000 $ 6.665.000 $ 4,296.000 $ 14.421.000 $ 125,100.000 $ 3,120.000 $ (11,994.000) $ (10.000) $ (965.000) $ 343.000 $ (12,626.000) $ 124,558.000 $ $ 44,183.000 $ $ 70,869.000 $ 10/02/2022 3rd Quarter USD Unaudited Yes Millions 11,355.000 $ 21,585.000 $ 22,724.000 $ 16,091.000 $ 16,362.000 $ 201.000 $ 15,890.000 $ 1,730.000 $ 2,106.000 $ 7,839.000 $ 223.000 $ 16,139.000 1,696.000 2,324.000 $ 11,675.000 $ 3,592.000 $ 65,236.000 $ 46,681.000 $ 7,417.000 $ 11,437.000 $ 3,703.000 $ 63,847.000 $ 47,144.000 $ 28,529.000 $ 28,790.000 $ 18,152.000 $ 18,354.000 $ 40,336.000 $ 42,408.000 $ 33,383.000 $ 34,166.000 $ 9,392.000 $ 8,625.000 $ 9,514.000 $ 9,435.000 $ 175,124.000 $177,724.000 $ 4,424.000 $ 4,305.000 $ 10,153.000 $ 11,953.000 $ 07/03/2022 2nd Quarter USD Unaudited Yes Millions 10,983.000 $ 14,021.000 $ 3,006.000 $ 1,986.000 $ 45,543.000 $ 25,610.000 $ 1,985.000 $ 8.000 $ 27,603.000 $ 4,946.000 $ 8,353.000 $ (2,358.000) $ (922.000) $ (15,292.000) $ 9,765.000 $ 12,607.000 $ 13,447.000 $ 2,717.000 $ 1,980.000 $ 44,821.000 $ 26,297.000 $ 1,985.000 $ 10.000 $ 28,292.000 $ 5,015.000 8,553.000 4,162.000 $ 4,162.000 9,918.000 $ 100,525.000 $ 3,120.000 $ (11,974.000) $ 10,524.000 101,367.000 3,120.000 $ (10,722.000) $ (38.000) $ (36.000) $ (2,472.000) $ (613.000) $ (13,843.000) $ 127,917.000 $ 126,216.000 $ 41,146.000 $ 39,136.000 $ 74,599.000 $ 76,357.000 $ 04/03/2022 1st Quarter USD Unaudited Yes Millions 10,463.000 $ 19,925.000 $ 15,828.000 $ 234.000 $ 15,594.000 $ 1,679.000 $ 2,629.000 $ 6,682.000 $ 10,990.000 $ 3,452.000 $ 60,424.000 $ 47,702.000 $ 29,001.000 $ 18,701.000 $ 44,420.000 $ 34,935.000 $ 9,936.000 $ 9,939.000 $ 178,355.000 $ 4,297.000 $ 9,309.000 $ 13,006.000 $ 12,972.000 $ 2,098.000 $ 1,708.000 $ 43,390.000 $ 26,859.000 $ 1,985.000 $ 7.000 $ 28,851.000 $ 6,424.000 $ 8,739.000 $ 5,745.000 $ 10,497.000 $ 103,646.000 $ 3,120.000 $ (10,571.000) $ (16.000) (2,538.000) $ (632.000) $ (13,757.000) $ 124,380.000 $ 39,034.000 $ 74,709.000 $ 10/03/2021 3rd Quarter USD Unaudited Yes Millions 17,604.000 $ 13,397.000 $ 15,134.000 $ 223.000 $ 14,911.000 $ 1,587.000 $ 2,164.000 $ 6,636.000 $ 10,387.000 $ 3,590.000 $ 59,889.000 $ 47,347.000 $ 28,869.000 $ 18,478.000 $ 47,776.000 $ 35,569.000 $ 10,646.000 $ 6,870.000 $ 179,228.000 $ 3,798.000 $ 8,961.000 $ 13,812.000 $ 12,683.000 $ 3,146.000 $ 2,161.000 $ 44,561.000 $ 28,141.000 $ 1,984.000 $ 5.000 $ 30,130.000 $ 7,147.000 $ 10,171.000 $ 5.770.000 $ 11,177.000 $ 108,956.000 $ 3,120.000 $ (9,179.000) $ (6,257.000) $ 21.000 $ (15,415.000) $ 121,092.000 $ 38,525.000 $ 70,272.000 $ 07/04/2021 2nd Quarter USD Unaudited Yes Millions 14,332.000 $ 10,974.000 $ 15,105.000 $ 234.000 $ 14,871.000 $ 1,576.000 $ 2,307.000 $ 6,217.000 $ 10,100.000 $ 3,492.000 $ 53,769.000 $ 47,201.000 $ 28,569.000 $ 18,632.000 $ 50,244.000 $ 35,819.000 $ 10,804.000 $ 7,172.000 $ 176,440.000 3,173.000 $ 8,704.000 $ 10,485.000 $ 12.450.000 $ 2,709.000 $ 1,200.000 $ 38,721.000 $ 28,319.000 $ 1,984.000 $ 7.000 $ 30,310.000 $ 9,016.000 $ 10,367.000 $ 5,722.000 $ 12,724.000 $ 106,860.000 3,120.000 $ (8,797.000) $ $ (6,490.000) $ 187.000 $ (15,100.000) $ 120,154.000 $ 38,594.000 $ 69,580.000 $ As Reported Quarterly Balance Sheet Report Date Currency Audit Status Consolidated Scale Cash & cash equivalents Restricted cash Marketable securities Accounts receivable, trade, gross Less: allowances Accounts receivable, trade Raw materials & supplies Goods in process Finished goods Inventories Prepaid expenses & other current assets Total current assets Property, plant & equipment at cost Less: accumulated depreciation Property, plant & equipment, net Intangible assets, net Goodwill Deferred taxes on income Other assets Total assets Loans & notes payable Accounts payable Accrued liabilities Accrued rebates, returns & promotions Accrued compensation & employee related obligations Accrued taxes on income Total current liabilities Notes Debentures Other long-term debt Long-term debt Deferred taxes on income Employee related obligations Long-term taxes payable Other liabilities Total liabilities Common stock Foreign currency translation Gain (loss) on securities Employee benefit plans Gain (loss) on derivatives & hedges Accumulated other comprehensive income (loss) Retained earnings & additional paid-in capital Retained earnings (accumulated deficit) Less: common stock held in treasury, at cost Total shareholders' equity (deficit) $ $ $ $ $ $ $ $ $ $ $ $ $ $ $ $ $ $ $ $ $ $ $ $ 04/02/2023 1st Quarter USD Unaudited Yes Millions 19,170.000 $ 7,695.000 5,443.000 $ 16,557.000 $ 207.000 $ 16,350.000 $ 2,267.000 $ 1,866.000 $ 8,676.000 $ 12,809.000 $ 2,921.000 $ 64,388.000 $ 50,367.000 $ 30,193.000 $ 20,174.000 $ 47,448.000 $ 45,575.000 $ 8,817.000 9,567.000 $ 195,969.000 $ 17,979.000 $ 9,909.000 $ 11,204.000 $ 14,784.000 $ 2,231.000 $ 4,266.000 $ 60,373.000 $ 25,461.000 $ 9,410.000 $ 57.000 $ 34,928.000 $ 4,417.000 $ 6.665.000 $ 4,296.000 $ 14.421.000 $ 125,100.000 $ 3,120.000 $ (11,994.000) $ (10.000) $ (965.000) $ 343.000 $ (12,626.000) $ 124,558.000 $ $ 44,183.000 $ $ 70,869.000 $ 10/02/2022 3rd Quarter USD Unaudited Yes Millions 11,355.000 $ 21,585.000 $ 22,724.000 $ 16,091.000 $ 16,362.000 $ 201.000 $ 15,890.000 $ 1,730.000 $ 2,106.000 $ 7,839.000 $ 223.000 $ 16,139.000 1,696.000 2,324.000 $ 11,675.000 $ 3,592.000 $ 65,236.000 $ 46,681.000 $ 7,417.000 $ 11,437.000 $ 3,703.000 $ 63,847.000 $ 47,144.000 $ 28,529.000 $ 28,790.000 $ 18,152.000 $ 18,354.000 $ 40,336.000 $ 42,408.000 $ 33,383.000 $ 34,166.000 $ 9,392.000 $ 8,625.000 $ 9,514.000 $ 9,435.000 $ 175,124.000 $177,724.000 $ 4,424.000 $ 4,305.000 $ 10,153.000 $ 11,953.000 $ 07/03/2022 2nd Quarter USD Unaudited Yes Millions 10,983.000 $ 14,021.000 $ 3,006.000 $ 1,986.000 $ 45,543.000 $ 25,610.000 $ 1,985.000 $ 8.000 $ 27,603.000 $ 4,946.000 $ 8,353.000 $ (2,358.000) $ (922.000) $ (15,292.000) $ 9,765.000 $ 12,607.000 $ 13,447.000 $ 2,717.000 $ 1,980.000 $ 44,821.000 $ 26,297.000 $ 1,985.000 $ 10.000 $ 28,292.000 $ 5,015.000 8,553.000 4,162.000 $ 4,162.000 9,918.000 $ 100,525.000 $ 3,120.000 $ (11,974.000) $ 10,524.000 101,367.000 3,120.000 $ (10,722.000) $ (38.000) $ (36.000) $ (2,472.000) $ (613.000) $ (13,843.000) $ 127,917.000 $ 126,216.000 $ 41,146.000 $ 39,136.000 $ 74,599.000 $ 76,357.000 $ 04/03/2022 1st Quarter USD Unaudited Yes Millions 10,463.000 $ 19,925.000 $ 15,828.000 $ 234.000 $ 15,594.000 $ 1,679.000 $ 2,629.000 $ 6,682.000 $ 10,990.000 $ 3,452.000 $ 60,424.000 $ 47,702.000 $ 29,001.000 $ 18,701.000 $ 44,420.000 $ 34,935.000 $ 9,936.000 $ 9,939.000 $ 178,355.000 $ 4,297.000 $ 9,309.000 $ 13,006.000 $ 12,972.000 $ 2,098.000 $ 1,708.000 $ 43,390.000 $ 26,859.000 $ 1,985.000 $ 7.000 $ 28,851.000 $ 6,424.000 $ 8,739.000 $ 5,745.000 $ 10,497.000 $ 103,646.000 $ 3,120.000 $ (10,571.000) $ (16.000) (2,538.000) $ (632.000) $ (13,757.000) $ 124,380.000 $ 39,034.000 $ 74,709.000 $ 10/03/2021 3rd Quarter USD Unaudited Yes Millions 17,604.000 $ 13,397.000 $ 15,134.000 $ 223.000 $ 14,911.000 $ 1,587.000 $ 2,164.000 $ 6,636.000 $ 10,387.000 $ 3,590.000 $ 59,889.000 $ 47,347.000 $ 28,869.000 $ 18,478.000 $ 47,776.000 $ 35,569.000 $ 10,646.000 $ 6,870.000 $ 179,228.000 $ 3,798.000 $ 8,961.000 $ 13,812.000 $ 12,683.000 $ 3,146.000 $ 2,161.000 $ 44,561.000 $ 28,141.000 $ 1,984.000 $ 5.000 $ 30,130.000 $ 7,147.000 $ 10,171.000 $ 5.770.000 $ 11,177.000 $ 108,956.000 $ 3,120.000 $ (9,179.000) $ (6,257.000) $ 21.000 $ (15,415.000) $ 121,092.000 $ 38,525.000 $ 70,272.000 $ 07/04/2021 2nd Quarter USD Unaudited Yes Millions 14,332.000 $ 10,974.000 $ 15,105.000 $ 234.000 $ 14,871.000 $ 1,576.000 $ 2,307.000 $ 6,217.000 $ 10,100.000 $ 3,492.000 $ 53,769.000 $ 47,201.000 $ 28,569.000 $ 18,632.000 $ 50,244.000 $ 35,819.000 $ 10,804.000 $ 7,172.000 $ 176,440.000 3,173.000 $ 8,704.000 $ 10,485.000 $ 12.450.000 $ 2,709.000 $ 1,200.000 $ 38,721.000 $ 28,319.000 $ 1,984.000 $ 7.000 $ 30,310.000 $ 9,016.000 $ 10,367.000 $ 5,722.000 $ 12,724.000 $ 106,860.000 3,120.000 $ (8,797.000) $ $ (6,490.000) $ 187.000 $ (15,100.000) $ 120,154.000 $ 38,594.000 $ 69,580.000 $
Expert Answer:

Related Book For 

Essentials of Managerial Finance
ISBN: 978-0324422702
14th edition
Authors: Scott Besley, Eugene F. Brigham
Posted Date:
Students also viewed these finance questions
-
A firm's stock is currently trading at $40 per share. Assume that the firm is in a stable growth phase with an expected long-term cashflow growth of 2.5%. Effective tax rate is 25%. The firm's debt...
-
Part 1: The Trolley Tay Company manufactures toy building block sets for children. Trolley is planning for 2019 by developing a master budget by quarters. Trolley's balance sheet for December 31,...
-
Advertising plays a major role in the ______________ stage of the product life cycle, and_______________ plays a major role in the maturity stage.
-
On May 1 2012, Jaguchi issued $300,000 of 12%, 5-year bonds for $294,200 plus accrued interest. The bonds are dated March 1, 2012, and pay semiannual interest on March 1 and September 1. Jaguchi uses...
-
Nicholson Roofing Materials, Inc., is considering two mutually exclusive projects, each with an initial investment of $150,000. The companys board of directors has set a maximum 4-year payback...
-
Consider a stock price \(S\) governed by the geometric Brownian motion process (a) Using \(\Delta t=1 / 12\) and \(S(0)=1\), simulate several (i.e., many) years of this process using either method,...
-
You have a choice of borrowing money from a finance company at 24 percent compounded monthly or borrowing money from a bank at 26 percent compounded annually. Which alternative is the most attractive?
-
QS 12-4 (Static) Indirect: Computing cash flows from operations LO P2 Cain Incorporated reports net income of $15,000. Its comparative balance sheet shows the following changes: accounts receivable...
-
University researchers create a positive externality because what they discover in their research laboratories can be easily learned by others who have not contributed to the researchers' costs. What...
-
Read about the life of a moral reformer or examine the life of your own moral hero or heroine. Respond to the following questions: What motivated the person of your choice to continue, even when the...
-
Consider a stock with current price So over a period of length T. Let u and d denote relationships between the current price So and two possible closing prices ST, where the "high" possible price is...
-
Explain why your variable is important and deserves to be monitored, explained and predicted. 2. Create a graph in Excel showing the evolution of your chosen variable since 2000 till June 2023. 3....
-
The chief legal officer (CLO) of Amazon, Inc. is impressed with your knowledge of global economics and has asked you to gather data on institutions governing trade and the types of trade...
-
should be able to evaluate the key macroeconomic indicators data of a country and determine the best fiscal and monetary policies for managing growth, inflation and unemployment, while formulating...
-
Bella is married to Fred. She met Fred online and moved from South America to live in Australia with Fred. Bella speaks English but is not proficient in reading and writing English. Bella works in...
-
Assume that a trial balance is prepared with an account balance of $21,360 listed as $21,630 and an account balance of $1,500 listed as $15,000. Identify the transposition and the slide.
-
The Singleton Company must decide between two mutually exclusive investment projects. Each project costs $6,750 and has an expected life of three years. Annual net cash flows from each project begin...
-
Your broker offers to sell you some shares of Wingler & Company common stock, which paid a dividend of $2 yesterday.You expect the dividend to grow at a rate of 5 percent per year into perpetuity....
-
How does a firm force investors to convert their convertible bonds (or convertible preferred stock) into its common stock?
-
Graph the discrete probability distribution given in Table 1 from Example 2. Approach In the graph of a discrete probability distribution, the horizontal axis represents the values of the discrete...
-
Compute the mean of the discrete random variable given in Table 1 from Example 2. Approach Find the mean of a discrete random variable by multiplying each value of the random variable by its...
-
Which of the following is a discrete probability distribution? Approach In a discrete probability distribution, the sum of the probabilities must equal 1, and all probabilities must be between 0 and...

Study smarter with the SolutionInn App