

Question: in matlab (12pts) Write a script to plot y1 = x + 2 for x values ranging from -5 to 5 using 50 points as
 in matlab
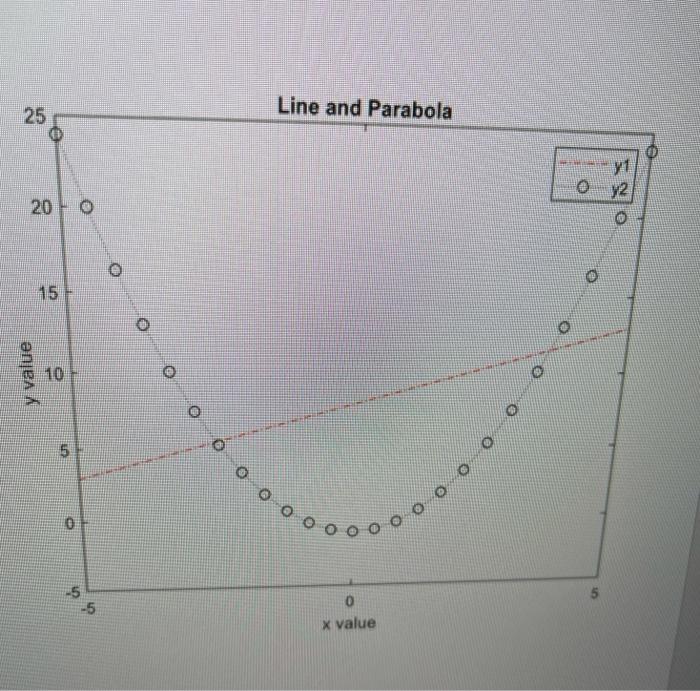
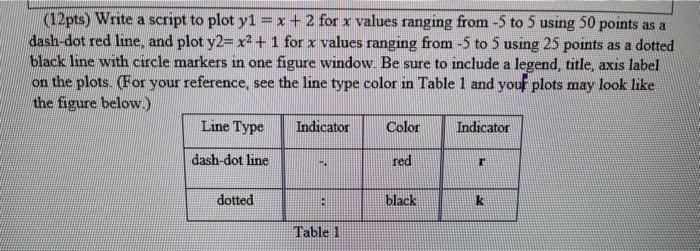
(12pts) Write a script to plot y1 = x + 2 for x values ranging from -5 to 5 using 50 points as a dash-dot red line and plot y2= x2 + 1 for x values ranging from -5 to 5 using 25 points as a dotted black line with circle markers in one figure window. Be sure to include a legend, title, axis label on the plots. (For your reference, see the line type color in Table 1 and your plots may look like the figure below.) Line Type Indicator Color Indicator dash-dot line red dotted black k Table 1 25 Line and Parabola y2 20 - 0 e 15 o y value 10 5 @ 0 0000 5 -5 -5 0 x value
Step by Step Solution
There are 3 Steps involved in it
1 Expert Approved Answer
Step: 1 Unlock

Question Has Been Solved by an Expert!
Get step-by-step solutions from verified subject matter experts
Step: 2 Unlock
Step: 3 Unlock