

Question: in MATLAB. 2. Given the data appearing in the table below, do a linear interpolation to find matching y- values for the following set of
in MATLAB.
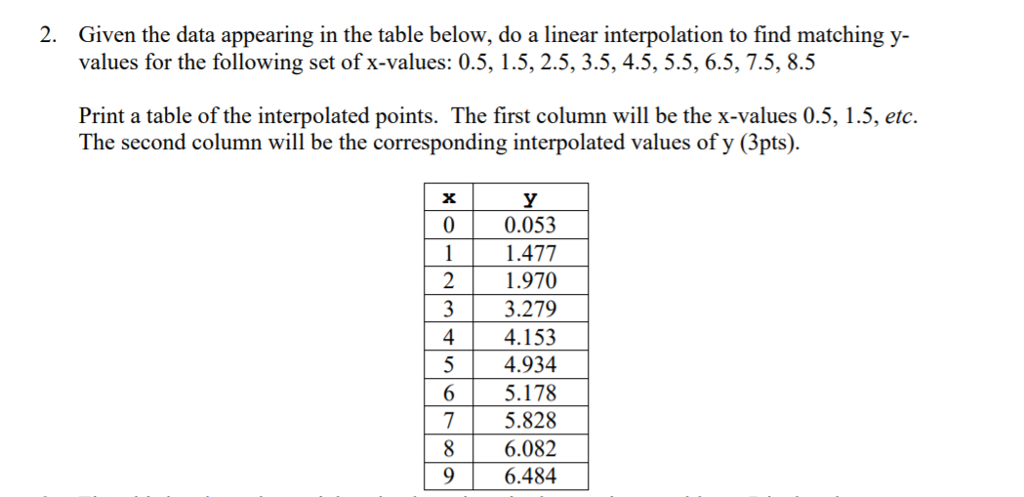
2. Given the data appearing in the table below, do a linear interpolation to find matching y- values for the following set of x-values: 0.5, 1.5,2.5, 3.5, 4.5, 5.5, 6.5, 7.5, 8.5 Print a table of the interpolated points. The first column will be the x-values 0.5, 1.5, etc The second column will be the corresponding interpolated values of y (3pts) 0 0.053 1.477 21.970 3 3.279 4 4.153 5 4.934 65.178 75.828 8 6.082 9 6.484
Step by Step Solution
There are 3 Steps involved in it
1 Expert Approved Answer
Step: 1 Unlock

Question Has Been Solved by an Expert!
Get step-by-step solutions from verified subject matter experts
Step: 2 Unlock
Step: 3 Unlock