

Question: In Matlab: BifurcDiagramDriver.m: %This m-file will run through a loop to create a bifurcation diagram %derivs = 'saddlenode'; saddlenodehandle = @saddlenode; check_function = isa(saddlenodehandle, 'function_handle');
In Matlab:
BifurcDiagramDriver.m:
%This m-file will run through a loop to create a bifurcation diagram %derivs = 'saddlenode'; saddlenodehandle = @saddlenode; check_function = isa(saddlenodehandle, 'function_handle'); if ~check_function fprintf('ERROR: Did not get handle to function. '); end dim=1; y_init = -0.1; T0 = 0; Tspan = [0 20]; count=0; rrange=[-5:0.1:0.0]; %Change this as appropriate for given bifurcation type %Try to eliminate ranges where solution shoots off %to infinity ysave=[ ]; for r=-5:0.1:0.0 %set this equal to the rrange values above clear t; clear y; [t,y]=ode45(@(t,y)saddlenodehandle(t,y,r),Tspan,y_init); count = count+1; ysave(count,:) = y(end,:); end plot(rrange,ysave); %Next see if we can reverse time and find the unstable branches saddlenodehandle2 = @saddlenode_revT; check_function2 = isa(saddlenodehandle2, 'function_handle'); if ~check_function2 fprintf('ERROR: Did not get handle to function. '); end count=0; y_init=0; rrange2=[-5:0.1:0.0]; ysave_unstable = [ ]; for r=-5.0:0.1:0.0 clear t; clear y; [t,y]=ode45(@(t,y)saddlenodehandle2(t,y,r),Tspan,y_init); count = count+1; ysave_unstable(count,:) = y(end,:); end if (length(rrange2)==length(ysave_unstable)) hold on,plot(rrange2,ysave_unstable,'r-'); else LL=length(ysave_unstable) figure,plot(ysave_unstable) end
return
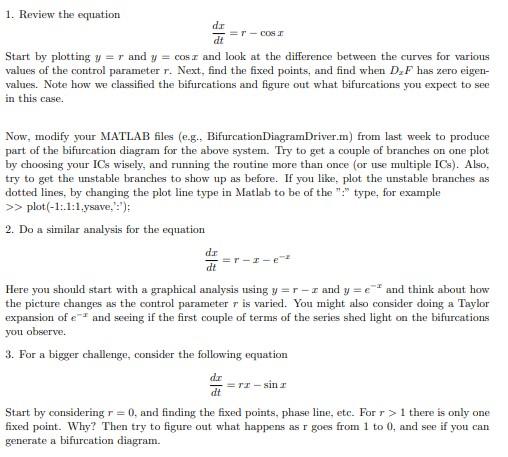
1. Review the equation dtdx=rcosx Start by plotting y=r and y=cosx and look at the difference between the curves for various values of the control parameter r. Next, find the fixed points, and find when DxF has zero eigenvalues. Note how we classified the bifurcations and figure out what bifurcations you expect to see in this case. Now, modify your MATLAB files (e.g., BifurcationDiagramDriver.m) from last week to produce part of the bifurcation diagram for the above system. Try to get a couple of branches on one plot by choosing your ICs wisely, and running the routine more than once (or use multiple ICs). Also, try to get the unstable branches to show up as before. If you like, plot the unstable branches as dotted lines, by changing the plot line type in Matlab to be of the "?" type, for example >plot(1:1:1, ysave,,) : 2. Do a similar analysis for the equation dtdx=rxex Here you should start with a graphical analysis using y=rx and y=ex and think about how the picture changes as the control parameter r is varied. You might also consider doing a Taylor expansion of ex and seeing if the first couple of terms of the series shed light on the bifurcations you observe. 3. For a bigger challenge, consider the following equation dtdx=rxsinx Start by considering r=0, and finding the fixed points, phase line, etc. For r>1 there is only one fixed point. Why? Then try to figure out what happens as r goes from 1 to 0 , and see if you can generate a bifurcation diagram
Step by Step Solution
There are 3 Steps involved in it

Get step-by-step solutions from verified subject matter experts