

Question: In Matlab, Create a histogram for each of the class distributions {classOne, classTwo}. Plot each of the histograms on the same figure (use 100 bins).
- In Matlab, Create a histogram for each of the class distributions {classOne, classTwo}. Plot each of the histograms on the same figure (use 100 bins). The x and y axis should be labeled appropriately. There should be a title for the figure as well as a legend.
histogram(classOne,100)
xlabel ('x axis')
ylabel ('y axis')
legend ('x')
title('Class One');
(I got that part done^)
How do I do this part?
- Report the prior probability for classOne? (Hint: Number of classOne samples divided by all samples)
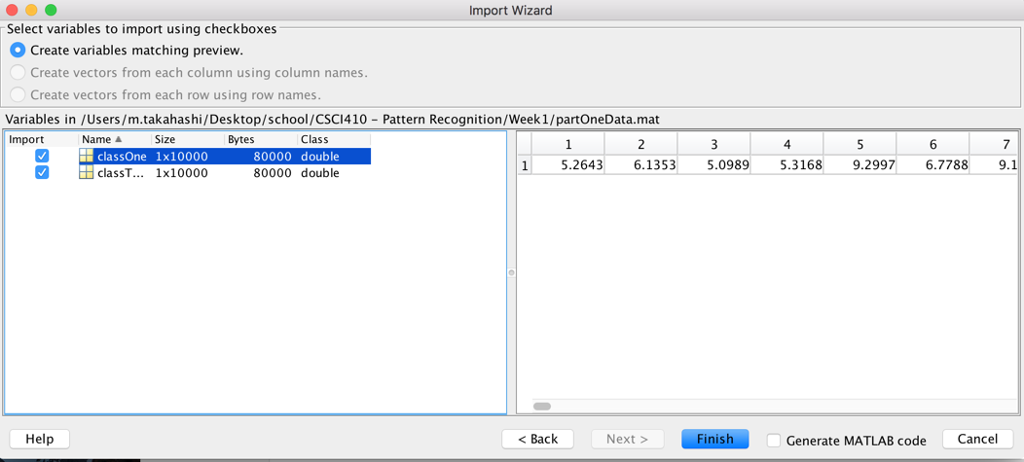
Import Wizard Select variables to import using checkboxes Create variables matching preview Create vectors from each column using column names Create vectors from each row using row names Variables in/Users/m.takahashi/Desktop/school/CSC1410-Pattern Recognition/Week 1/partOneData.mat Import Name Bytes Class ize 4 classOne 1x10000 clasST 1x10000 80000 double 80000 double 5.26436.1353 5.0989 5.3168 9.2997 6.7788 9.1
Step by Step Solution
There are 3 Steps involved in it
1 Expert Approved Answer
Step: 1 Unlock

Question Has Been Solved by an Expert!
Get step-by-step solutions from verified subject matter experts
Step: 2 Unlock
Step: 3 Unlock