

Question: in matlab Experimental data is often noisy and does not always fit a perfect line. To create an approximate equation, the Least Squares Method is
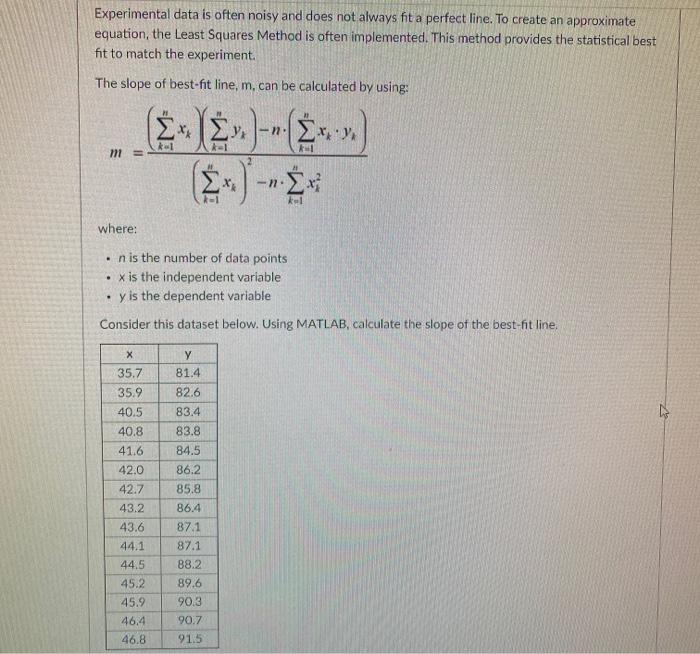
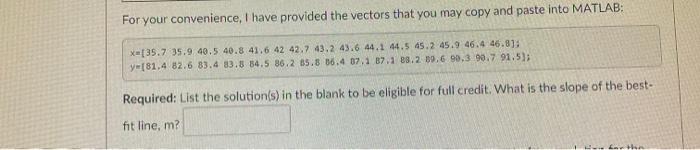
Experimental data is often noisy and does not always fit a perfect line. To create an approximate equation, the Least Squares Method is often implemented. This method provides the statistical best fit to match the experiment. The slope of best-fit line, m, can be calculated by using: kal mi * -N K-1 where: . . n is the number of data points X is the independent variable y is the dependent variable . Consider this dataset below. Using MATLAB, calculate the slope of the best-fit line. X 35.7 35.9 40.5 40.8 41.6 42.0 42.7 43.2 43.6 44.1 44.5 45.2 81.4 82.6 83.4 83.8 84.5 86.2 85.8 86.4 87.1 87.1 88.2 89.6 90.3 90.7 45.9 46,4 46.8 91.5 For your convenience, I have provided the vectors that you may copy and paste into MATLAB: X=(35.7 35.9 40.5 40.8 41.6 42 42.7 43.243.6 44.1 44.5 45.2 45.9 46.4 46.81: y[81.4 82.6 83.4 33.5 34.5 86.2 85.8 36.4 07.1 87.1 18.2 39.6 99.3 90.7 91.5); Required: List the solution(s) in the blank to be eligible for full credit. What is the slope of the best- fit line, m? - Car
Step by Step Solution
There are 3 Steps involved in it

Get step-by-step solutions from verified subject matter experts