

in matlab The readmatrix command is used to import data from excel. It is used in the
Question:
in matlab
The readmatrix command is used to import data from excel. It is used in the format dataVariable = readmatrix('filename.xlsx', options...) where options can either be an object with optional settings or just a set of inputs to tell MATLAB how to format the data. By default, MATLAB will try to interpret the data the best it can but the option settings can be specifically set to represent what how the data is formated.
Options
Sometimes we'll have data with varying formats, different sheets, etc. We want to be able to instruct MATLAB how to interpret the data, the following is an example. We can either create an options object and set settings accordingly, or, if the data isn't too complex, we can just provide the options as "sets" of arguments.
For example, to specify the sheet to get the data from, we supply this pair of arguments 'Sheet', 'name_of_sheet' where the first defines what option, and the second provides the value. Then, to specify a range, we include this pair of arguments 'Range', 'the_range' where again, the first defines what option, and the second provides the value.
Let's run through an example.
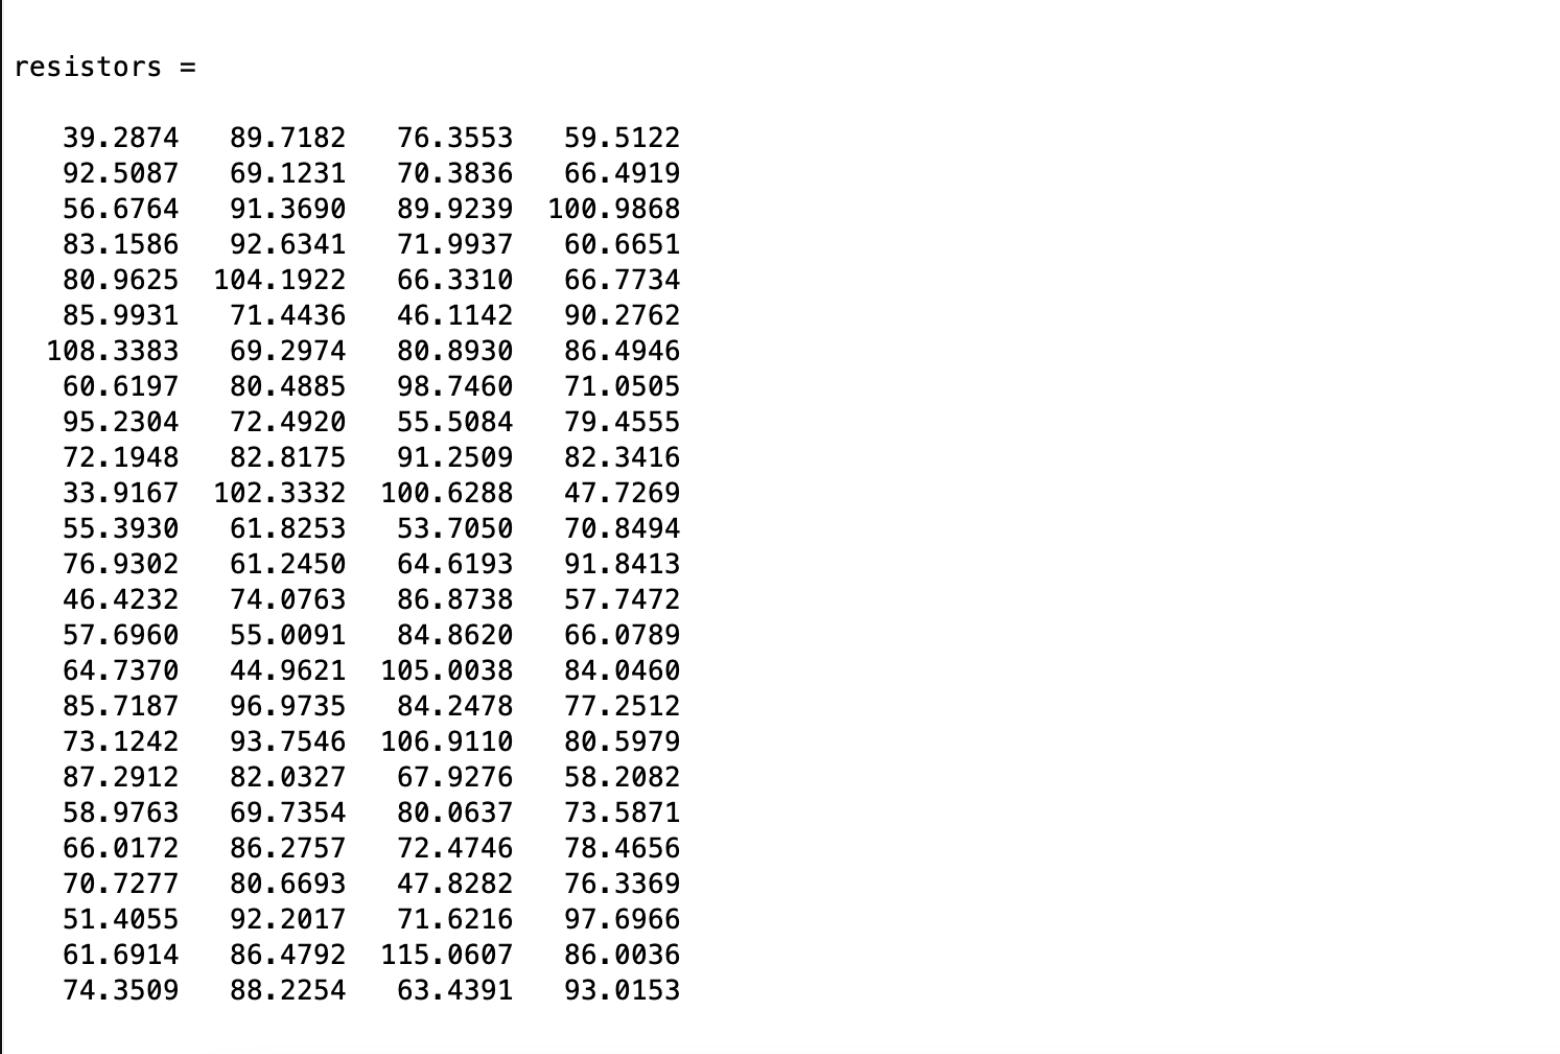
% Read range A4:D28 from the sheet named 'OldResistors' resistors = readmatrix('Tutorial_04_1_Data.xlsx','Sheet','OldResistors','Range','A4:D28') % The following would be acceptable as well, notice the pair of options still stays together but the order of the pairs does not matter. %resistors = readmatrix('Tutorial_04_1_Data.xlsx','Range','A4:D28','Sheet','OldResistors')
Data Manipulation
Checking out the size of the data
Now, let's take a look at what was imported, use the size() function to determine the size of the variable. Remember you can use the search bar or help size in the command window for more information
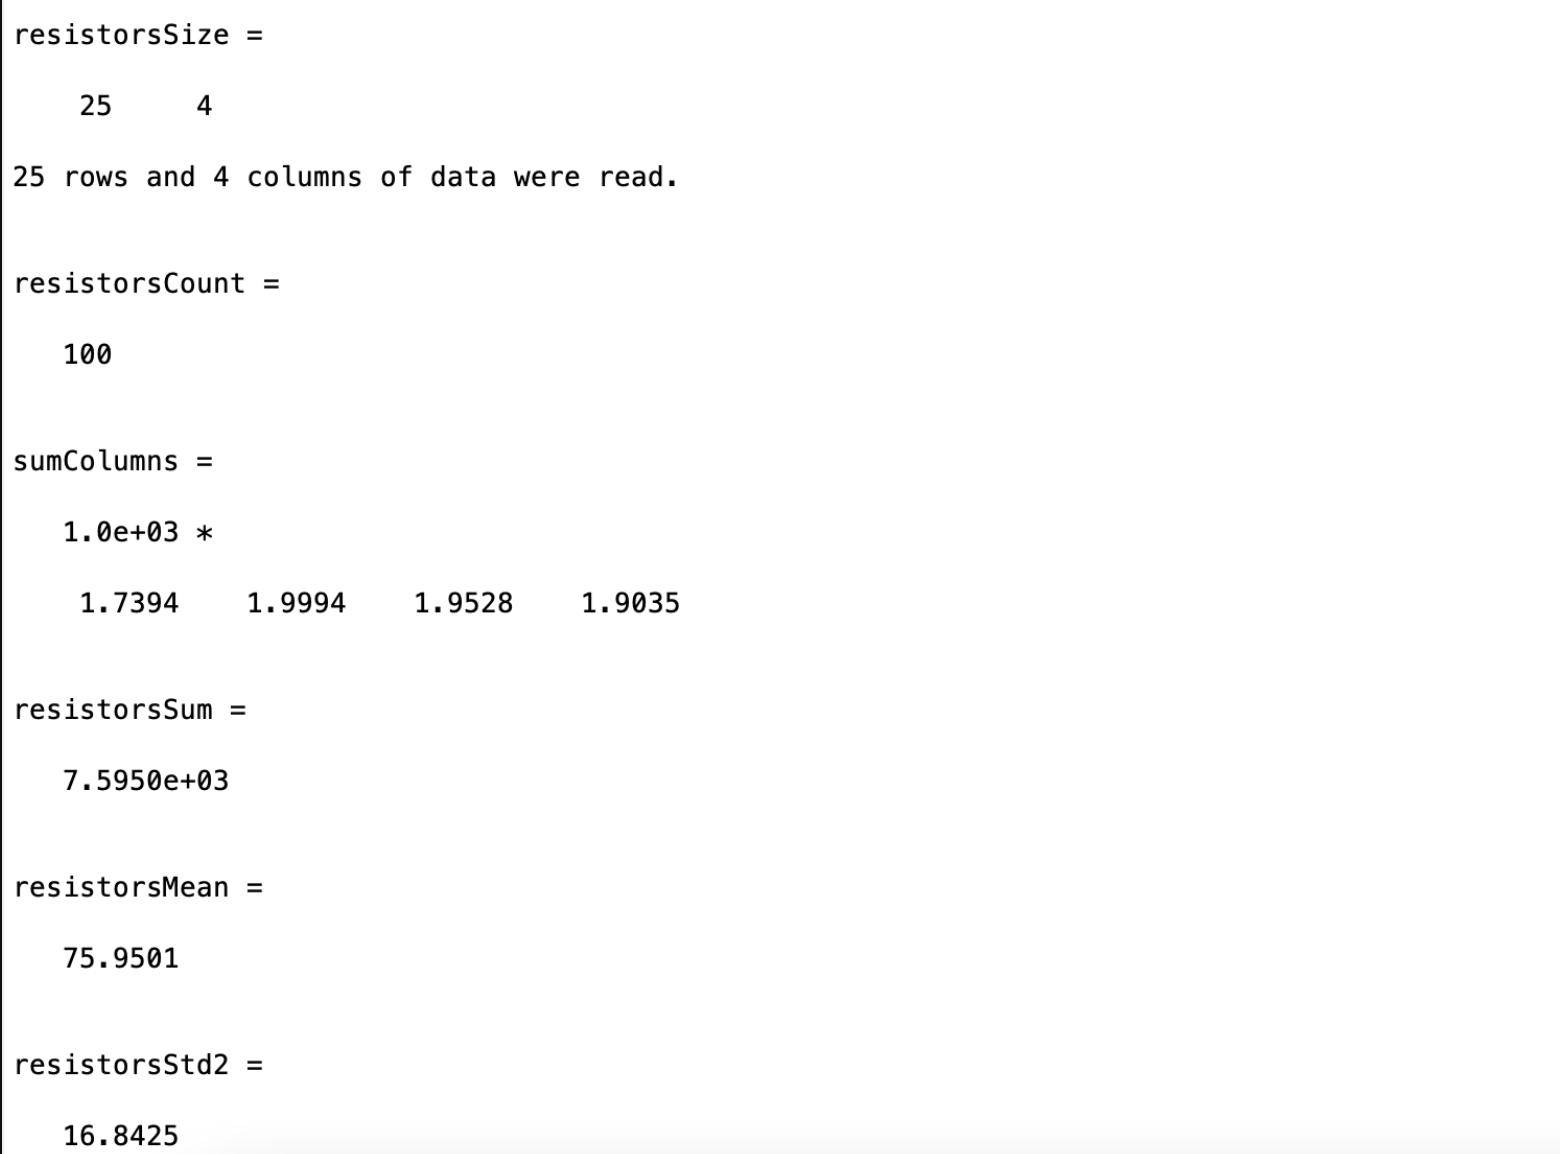
resistorsSize= fprintf('%i rows and %i columns of data were read.\n\n', resistorsSize)
You may not have seen this notation for fprintf before, because resistorsSize is a vector, fprintf will start pulling out each element one by one from left to right to fill the values for the format specifiers.
If you look at the output of assigning resistorsSize you should notice it's a 1x2 array. The first column, as you might expect, is the number of rows.
There are a few rows and columns, they're all resistor values. In the following code, get the row and column count values from resistorsSize and multiply them to compute the total number of resistors.
resistorsCount=
Let's do some math with sum()
Create a vector with the sum for each column in the resistors array.
sumColumns=
Create a scalar that will have the total value of all resistors combined. Again, using the sum() function.
resistorsSum=
Getting the mean
Now, compute the total mean of the resistors' values.
resistorsMean=
Getting the Standard Deviation
Normally, with a vector this would be simple, but we have a 2D array and can't simply run the std() function on our data. There are a few ways of computing the std dev for a 2D array.
The long way
% We can compute our own standard deviation using a vectorized formula % step 1: Compute (x-xmean)^2 for each value in matrix resistors. deviations=(resistors-resistorsMean).^2; % Creates a matrix of deviations % step 2: sum all the deviations sumDevColumns=sum(deviations); % vector containing sum of each column sumDeviations=sum(sumDevColumns); % sum of the column vectors = sum(x-xmean)^2 % step 3: compute sqrt(sum(x-xmean)^2)/(N-1)) resistorsStd=sqrt(sumDeviations/(resistorsCount-1));
The slightly shorter way, let's just make our data into a vector and call std()
% If there were more than 4 rows, we may want to use a for loop resistorsStd2=std([resistors(1,:),resistors(2,:),resistors(3,:),resistors(4,:)])
The shortest way, instead of supplying a row or column, just use a colon operator to get all values in a single column vector.
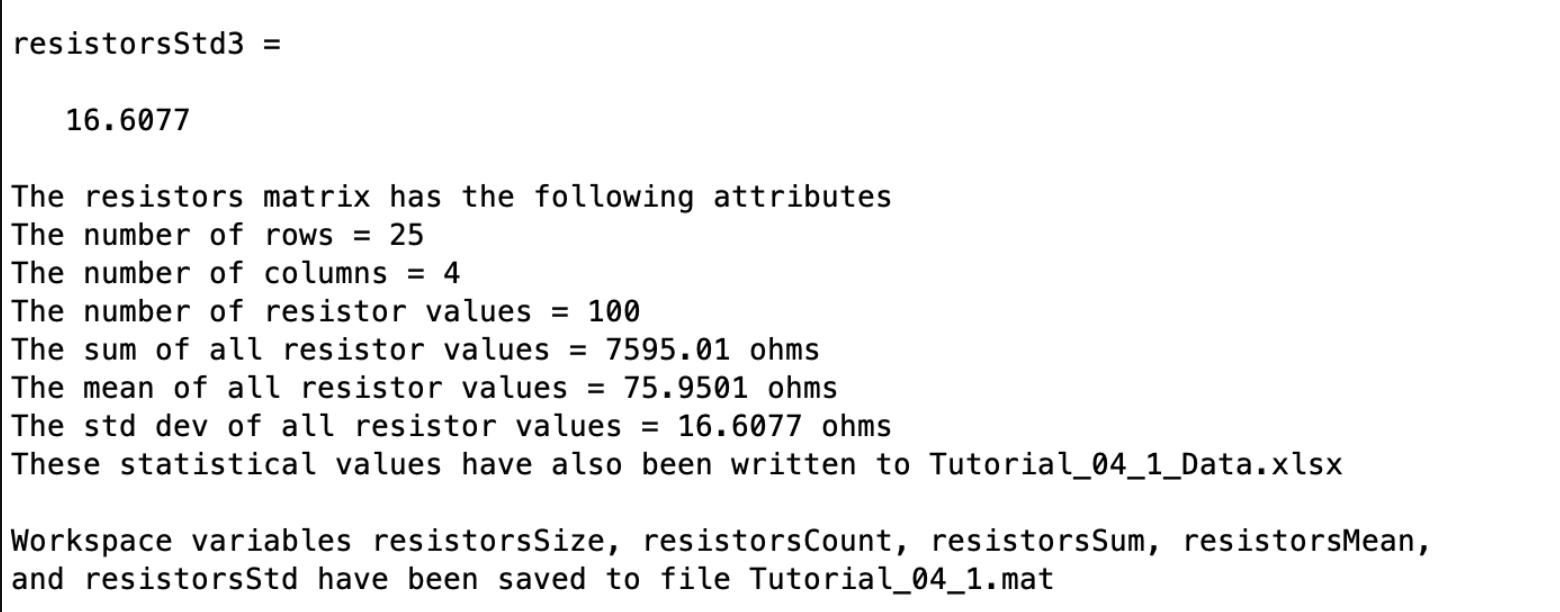
resistorsStd3=std(resistors(:))
Output
To the command window
Let's output our data to the command window
fprintf('The resistors matrix has the following attributes\n') fprintf('The number of rows = %i\n', resistorsSize(1)) fprintf('The number of columns = %i\n', resistorsSize(2)) fprintf('The number of resistor values = %i\n', resistorsCount) fprintf('The sum of all resistor values = %g ohms\n', resistorsSum) fprintf('The mean of all resistor values = %g ohms\n', resistorsMean) fprintf('The std dev of all resistor values = %g ohms\n', resistorsStd)
To the Excel spreadsheet
Now store the data in the original Excel spreadsheet using writematrix (formerly xlswrite)
Let's put the values in as follows.
- resistorsCount in cell H4 of sheet 'OldResistors'
- resistorsSum in cell H5 of sheet 'OldResistors'
- resistorsMean in cell H6 of sheet 'OldResistors'
- resistorsStd in cell H7 of sheet 'OldResistors'
I'll do the first one, it's in the format writematrix(value, filename, ... sheet and range params). We should use variables so we don't have to repeat things like the filename, and sheet name
filename='Tutorial_04_1_Data.xlsx'; sheetName='OldResistors'; writematrix(resistorsCount,filename,'Sheet',sheetName,'Range','H4:H4') % Notify the user that data is written to the Excel file fprintf('These statistical values have also been written to Tutorial_04_1_Data.xlsx \n\n')
To a .mat binary file
Finally, let's try saving some variables to a .mat binary file. Check the slides, book, or help doc if you don't remember how to save workspace variables. Save the following workspace variables to a file named Tutorial_04_1.mat
- resistorsSize
- resistorsCount
- resistorsSum
- resistorsMean
- resistorsStd
% Save some variables to Tutorial_04_1.mat % Notify the user that the variable have been saved fprintf('Workspace variables resistorsSize, resistorsCount, resistorsSum, resistorsMean,\n') fprintf('and resistorsStd have been saved to file Tutorial_04_1.mat\n\n')
Create a script of the same name, your output should match the following.
Expert Answer:


Accounting Information Systems The Crossroads of Accounting & IT
ISBN: 978-0132991322
2nd Edition
Authors: Donna Kay, Ali Ovlia
