

Question: In Matlab's Language: create a function that projects population based on static: Birth Rate (BR), Death Rate (DR). Migration will vary sinesoidally with time. Migration
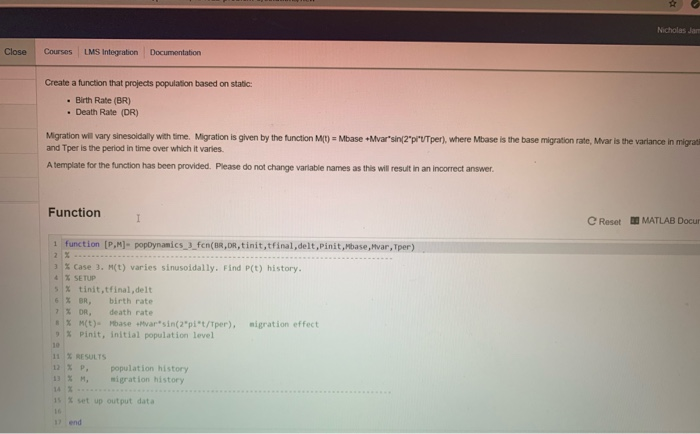
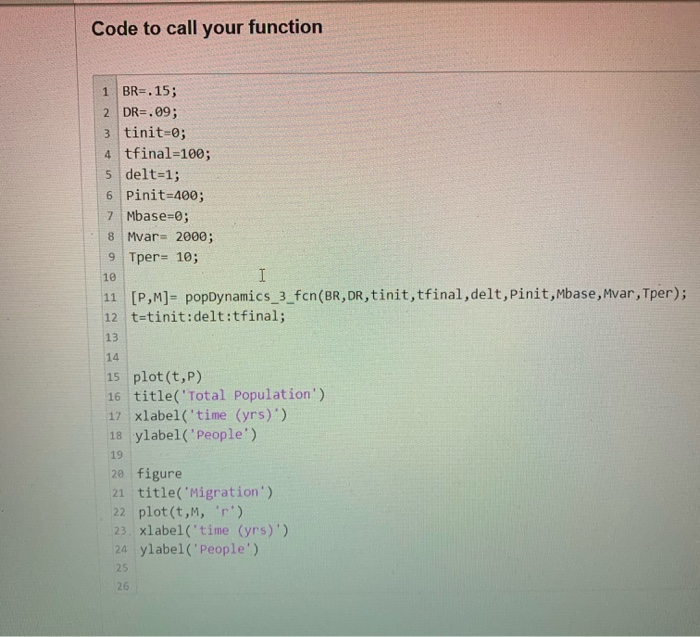
Nicholas Jor Close Courses LMS Integration Documentation Create a function that projects population based on static: Birth Rate (BR) Death Rate (DR) Migration will vary sinesoidally with time. Migration is given by the function Mt) = Mbase +Mvarsin(2"prUTper), where Mbase is the base migration rate, Mvar is the variance in migra and Tper is the period in time over which it varies A template for the function has been provided. Please do not change variable names as this will result in an incorrect answer Function Reset MATLAB Docu 1 function [PM]- popDynamics ) fon(R,DR, tinit,tfinal, delt, Pinit.Mbase, Hvar, Tper) 3 Case 3. m(t) varies sinusoidally. Find P(t) history. SETUP 5 X tinit.tfinal, delt 6 X BR birth rate x on, death rate. "X M(t) Mbase alvar sincaplt/1por), nigration effect Pinit, initial population level 11 12 1) M . population history i gration history 11 set up output data 11 end Code to call your function BR=.15; 2 DR=.09; tinit=0; 4 tfinal=100; 5 delt=1; 6 Pinit=400; 7 Mbase=0; 8 Mvar= 2000; 9 Tper= 10; 11 [P,M]- popDynamics_3_fcn(BR,DR, tinit,tfinal,delt, Pinit,Mbase, Mvar, Tper); 12 ttinit:delt:tfinal; 15 plot(t,P) 16 title('Total Population') 17 xlabel('time (yrs)') 18 ylabel('People') 19 20 figure 21 title('Migration) 22 plot(t,M,'r') 23. xlabel('time (yrs)') 24 ylabel('People') Assessment: Population Output is correct Migration is correct Preventing Privacy Patents | Trademarks | Privacy Policy 1994-2019 The MathWorks, Inc
Step by Step Solution
There are 3 Steps involved in it

Get step-by-step solutions from verified subject matter experts