

Question: In Part A, am I using the correct information to get the answers in the blue cells where the yellow arrow points? I included the
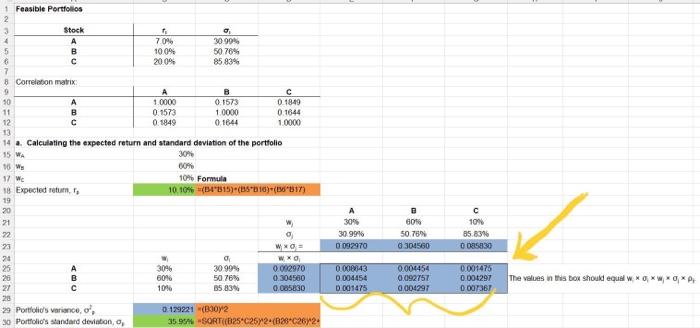
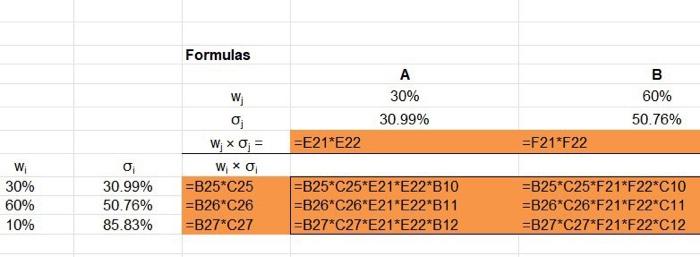
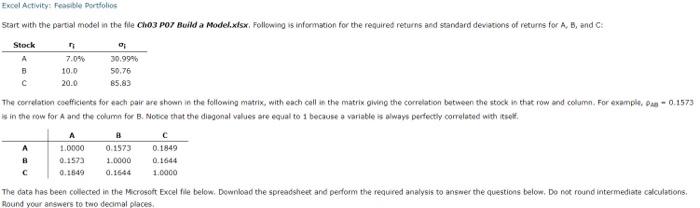
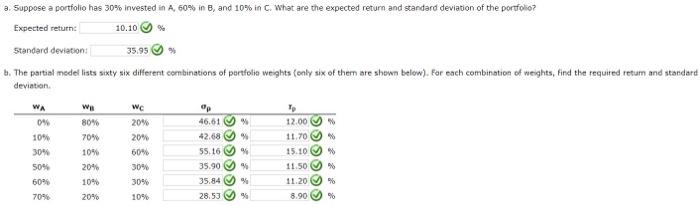
Feasible Portfolios a. Calculatina the expected return and standard deviation of the portsolio i velues in tris bon should equal w1w11r 101 c. Constructing a scatter diagram showing the required returns and standard deviations 102 103 104 105 106 106 108 109 110 111 112 113 113 114 116 117 118 119 120 121 122 123 124 124 126 127 Finding the smallest standard deviation that you must accept 128 Required return 10.80% 129 Smallest standard deviation #N/A Excel Activity: Feaselble portifolios sin the row for A and the column for B. Notice that the diagonal values are equal to 1 because a variable is always perfectly correlated with itself, a. Suppose a portfolio has 30% invested in A,60% in B, and 10% in C. What are the expected return and standard deviation of the portiolo? Expected return: o6. standard deviation: Feasible Portfolios a. Calculatina the expected return and standard deviation of the portsolio i velues in tris bon should equal w1w11r 101 c. Constructing a scatter diagram showing the required returns and standard deviations 102 103 104 105 106 106 108 109 110 111 112 113 113 114 116 117 118 119 120 121 122 123 124 124 126 127 Finding the smallest standard deviation that you must accept 128 Required return 10.80% 129 Smallest standard deviation #N/A Excel Activity: Feaselble portifolios sin the row for A and the column for B. Notice that the diagonal values are equal to 1 because a variable is always perfectly correlated with itself, a. Suppose a portfolio has 30% invested in A,60% in B, and 10% in C. What are the expected return and standard deviation of the portiolo? Expected return: o6. standard deviation
Step by Step Solution
There are 3 Steps involved in it

Get step-by-step solutions from verified subject matter experts