

Question: In preparation for your report in Project Two, you will need to calculate the financial ratios needed to determine your chosen businesss current financial health.
In preparation for your report in Project Two, you will need to calculate the financial ratios needed to determine your chosen businesss current financial health. Once youve calculated these ratios, the results will be used to analyze the businesss current financial position and help them make decisions about how to improve or maintain their financial health. Pay particular attention to working capital management. If liquidity is an issue, consider how the company will meet its short-term obligations.
Financial Calculations: Calculate accurate financial ratios to assess the businesss current financial health. Specifically, calculate the following ratios: Working capital Current ratio Debt ratio Earnings per share Price/earnings ratio Total asset turnover ratio Financial leverage Net profit margin Return on assets Return on equity
Fiscal Quarter Comparison: Using Mergent Online, summarize the differences between the results from your financial calculations of the most recent fiscal quarter and the results of the same financial calculations of the same fiscal quarter from a year before for your chosen business. For example, if the most recent fiscal quarter available is the 3rd quarter in 2020, then you will compare those results to the same financial calculations from the 3rd quarter in 2019.
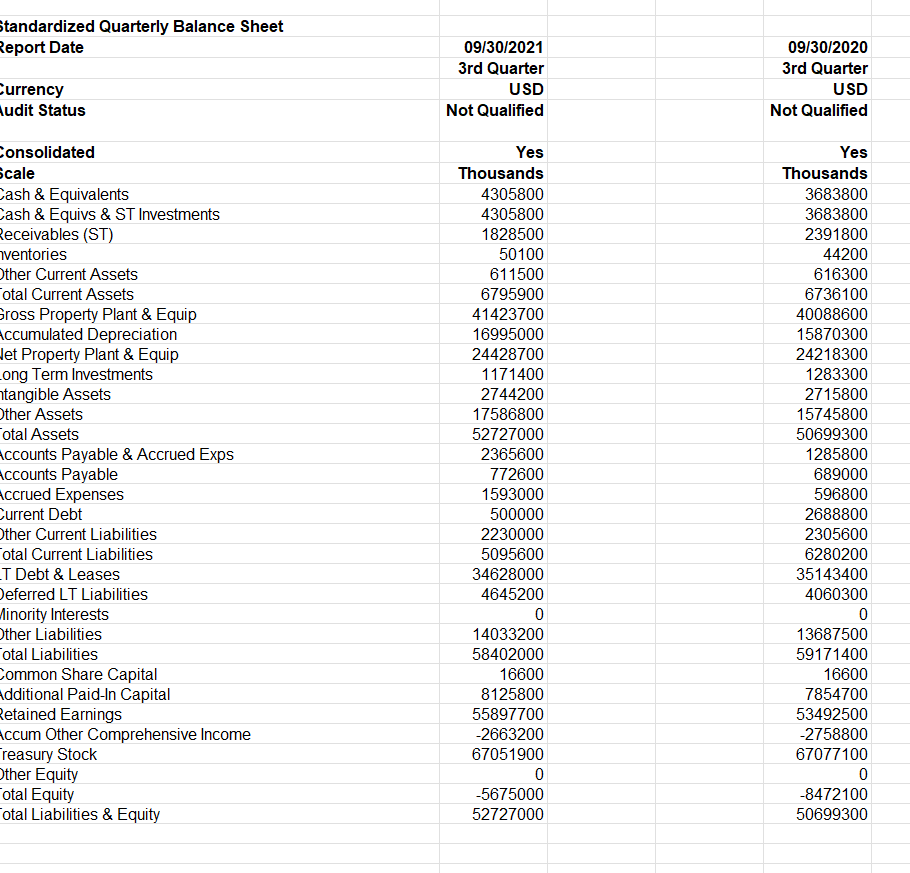
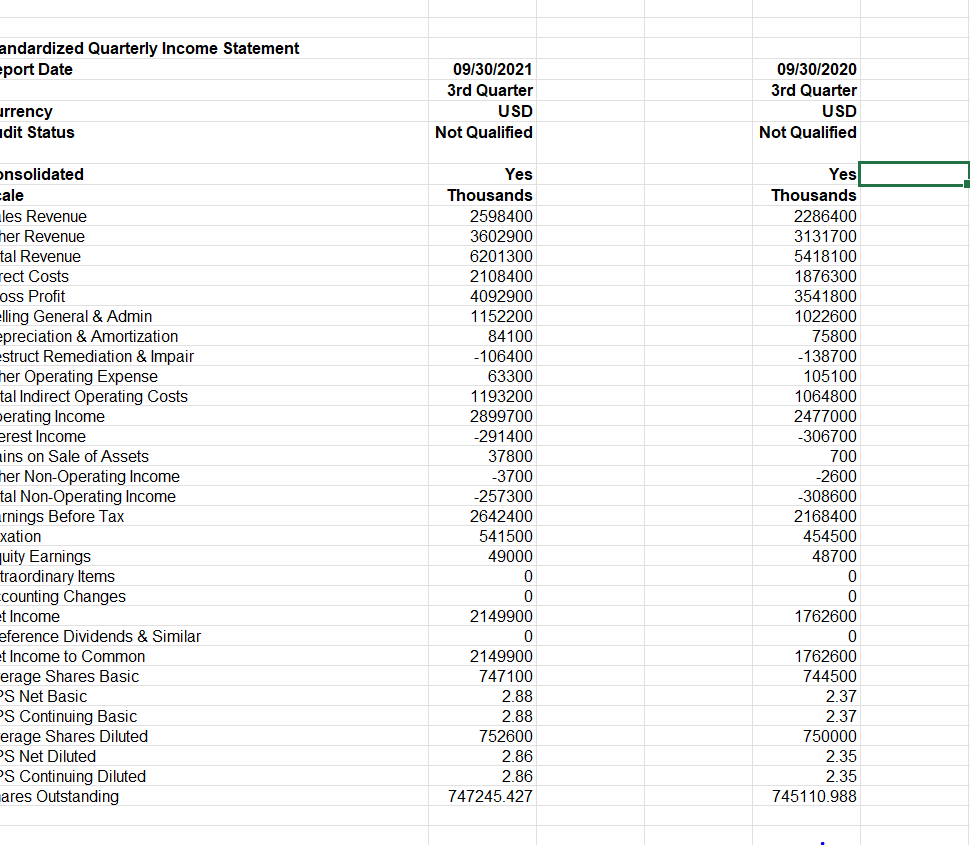
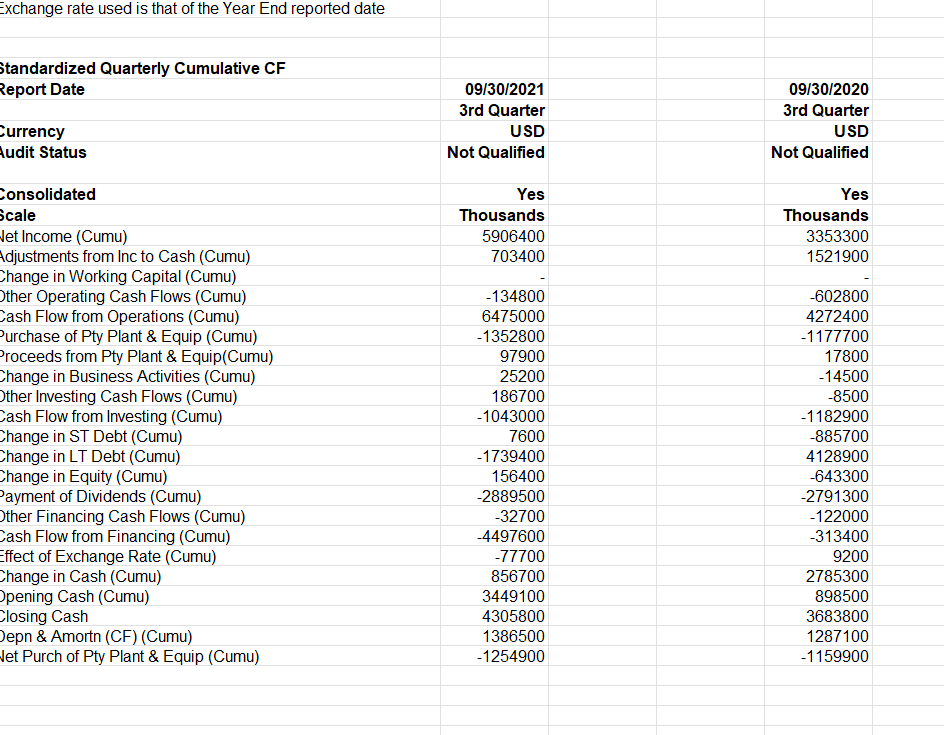
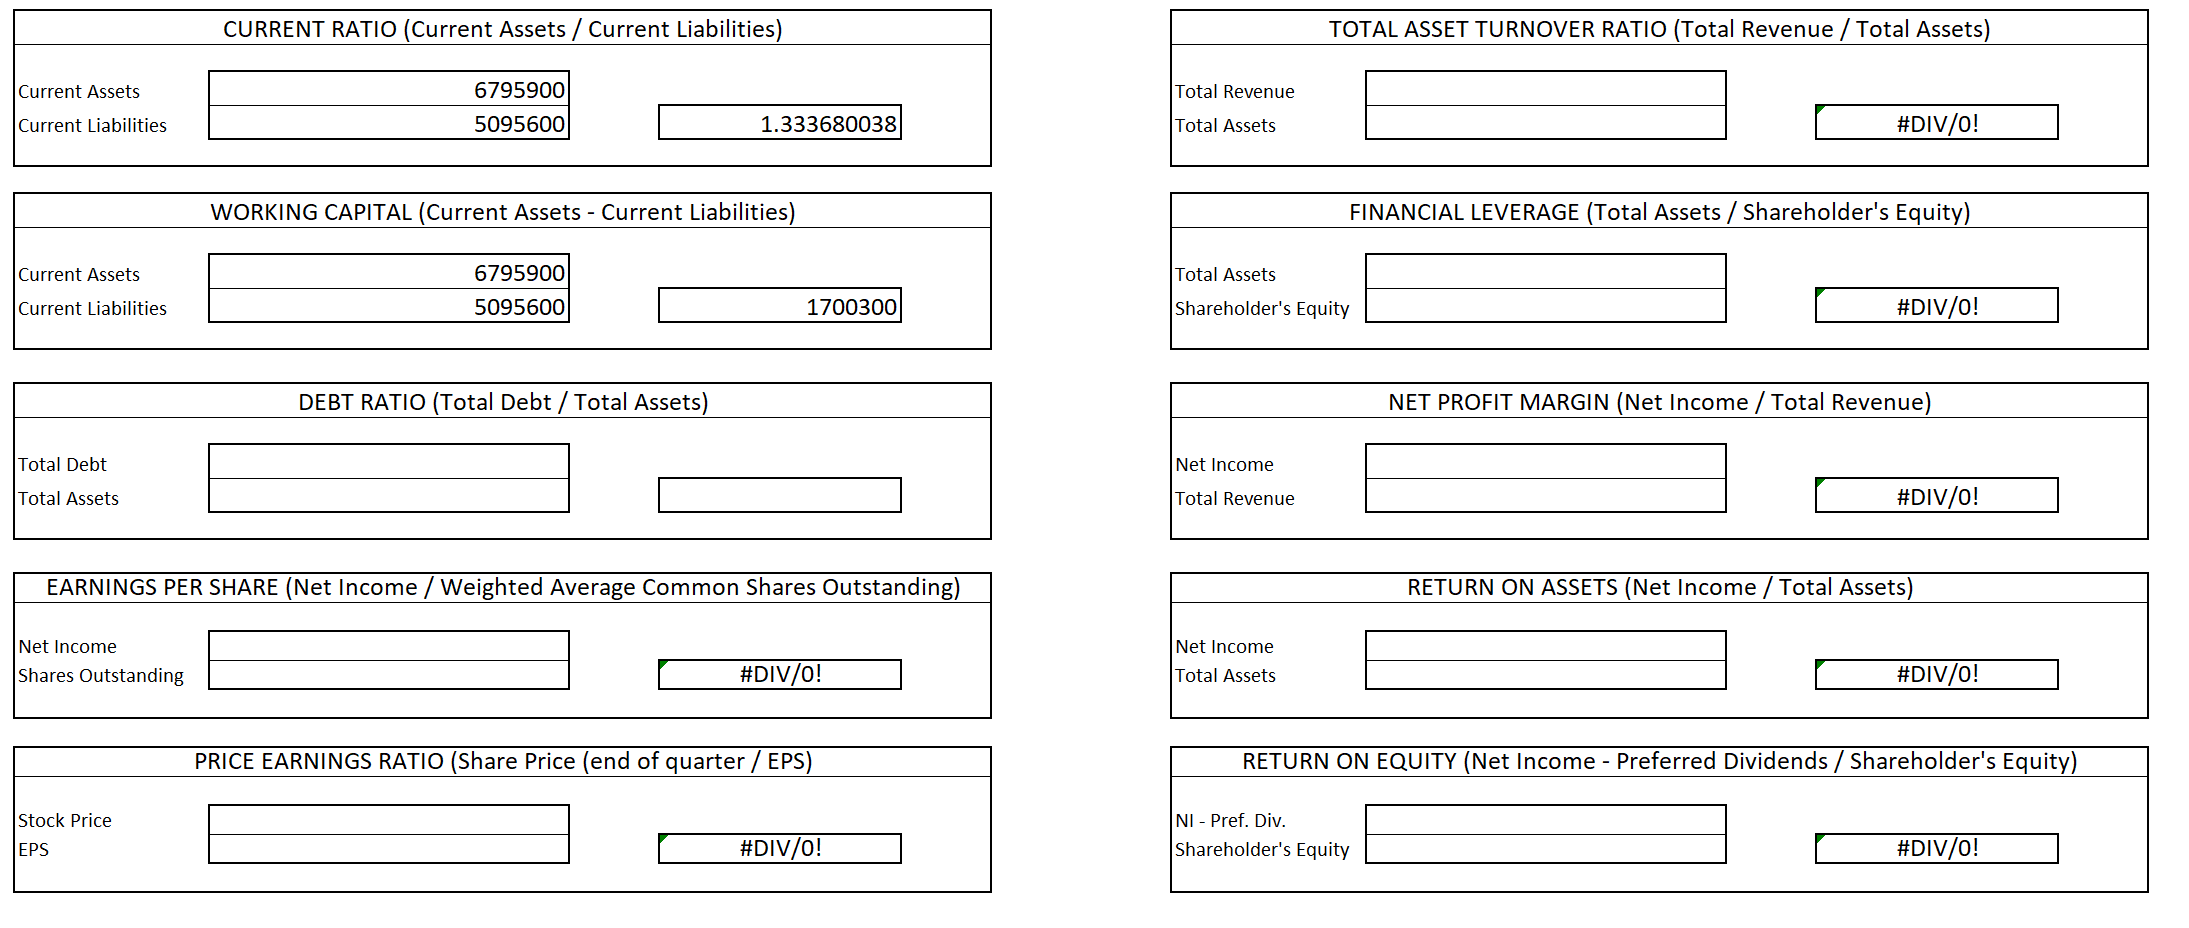
Standardized Quarterly Balance Sheet Report Date 09/30/2021 3rd Quarter USD Not Qualified 09/30/2020 3rd Quarter USD Not Qualified Currency Audit Status Consolidated Scale Cash & Equivalents Cash & Equivs & ST Investments Receivables (ST) ventories Other Current Assets otal Current Assets Gross Property Plant & Equip Accumulated Depreciation let Property Plant & Equip ong Term Investments ntangible Assets Other Assets otal Assets Accounts Payable & Accrued Exps Accounts Payable Accrued Expenses Current Debt Other Current Liabilities otal Current Liabilities T Debt & Leases Deferred LT Liabilities linority Interests Other Liabilities otal Liabilities Common Share Capital Additional Paid-In Capital Retained Earnings Accum Other Comprehensive Income Treasury Stock Other Equity Total Equity Cotal Liabilities & Equity Yes Thousands 4305800 4305800 1828500 50100 611500 6795900 41423700 16995000 24428700 1171400 2744200 17586800 52727000 2365600 772600 1593000 500000 2230000 5095600 34628000 4645200 0 14033200 58402000 16600 8125800 55897700 -2663200 67051900 0 -5675000 52727000 Yes Thousands 3683800 3683800 2391800 44200 616300 6736100 40088600 15870300 24218300 1283300 2715800 15745800 50699300 1285800 689000 596800 2688800 2305600 6280200 35143400 4060300 0 13687500 59171400 16600 7854700 53492500 -2758800 67077100 0 -8472100 50699300 andardized Quarterly Income Statement -port Date 09/30/2021 3rd Quarter USD Not Qualified 09/30/2020 3rd Quarter USD Not Qualified urrency dit Status nsolidated cale les Revenue ner Revenue tal Revenue rect Costs oss Profit elling General & Admin preciation & Amortization estruct Remediation & Impair ner Operating Expense tal Indirect Operating Costs erating Income erest Income ins on Sale of Assets her Non-Operating Income tal Non-Operating Income rnings Before Tax xation quity Earnings traordinary Items counting Changes t Income eference Dividends & Similar et Income to Common erage Shares Basic PS Net Basic S Continuing Basic erage Shares Diluted PS Net Diluted PS Continuing Diluted lares Outstanding Yes Thousands 2598400 3602900 6201300 2108400 4092900 1152200 84100 -106400 63300 1193200 2899700 -291400 37800 3700 -257300 2642400 541500 49000 0 0 2149900 0 2149900 747100 2.88 2.88 752600 Yes Thousands 2286400 3131700 5418100 1876300 3541800 1022600 75800 -138700 105100 1064800 2477000 -306700 700 -2600 -308600 2168400 454500 48700 0 0 1762600 0 1762600 744500 2.37 2.37 2.86 750000 2.35 2.35 745110.988 2.86 747245.427 Exchange rate used is that of the Year End reported date Standardized Quarterly Cumulative CF Report Date 09/30/2021 3rd Quarter USD Not Qualified 09/30/2020 3rd Quarter USD Not Qualified Currency Audit Status Yes Thousands 5906400 703400 Yes Thousands 3353300 1521900 Consolidated Scale Het Income (Cumu) Adjustments from Inc to Cash (Cumu) Change in Working Capital (Cumu) Other Operating Cash Flows (Cumu) Cash Flow from Operations (Cumu) Purchase of Pty Plant & Equip (Cumu) Proceeds from Pty Plant & Equip(Cumu) Change in Business Activities (Cumu) Other Investing Cash Flows (Cumu) Cash Flow from Investing (Cumu) Change in ST Debt (Cumu) Change in LT Debt (Cumu) Change in Equity (Cumu) Payment of Dividends (Cumu) Other Financing Cash Flows (Cumu) Cash Flow from Financing (Cumu) Effect of Exchange Rate (Cumu) Change in Cash (Cumu) Opening Cash (Cumu) Closing Cash Depn & Amortn (CF) (Cumu) Het Purch of Pty Plant & Equip (Cumu) -134800 6475000 -1352800 97900 25200 186700 -1043000 7600 -1739400 156400 -2889500 32700 -4497600 -77700 856700 3449100 4305800 1386500 -1254900 -602800 4272400 -1177700 17800 -14500 -8500 -1182900 -885700 4128900 -643300 -2791300 -122000 -313400 9200 2785300 898500 3683800 1287100 -1159900 CURRENT RATIO (Current Assets / Current Liabilities) TOTAL ASSET TURNOVER RATIO (Total Revenue / Total Assets) Current Assets Total Revenue 6795900 5095600 Current Liabilities 1.333680038 Total Assets #DIV/0! WORKING CAPITAL (Current Assets - Current Liabilities) FINANCIAL LEVERAGE (Total Assets / Shareholder's Equity) Current Assets Total Assets 6795900 5095600 Current Liabilities 1700300 Shareholder's Equity #DIV/0! DEBT RATIO (Total Debt / Total Assets) NET PROFIT MARGIN (Net Income / Total Revenue) Total Debt Net Income Total Assets Total Revenue #DIV/0! EARNINGS PER SHARE (Net Income / Weighted Average Common Shares Outstanding) RETURN ON ASSETS (Net Income / Total Assets) Net Income Net Income Shares Outstanding #DIV/0! Total Assets #DIV/0! PRICE EARNINGS RATIO (Share Price (end of quarter / EPS) RETURN ON EQUITY (Net Income - Preferred Dividends / Shareholder's Equity) Stock Price EPS #DIV/0! NI - Pref. Div. Shareholder's Equity #DIV/0! Standardized Quarterly Balance Sheet Report Date 09/30/2021 3rd Quarter USD Not Qualified 09/30/2020 3rd Quarter USD Not Qualified Currency Audit Status Consolidated Scale Cash & Equivalents Cash & Equivs & ST Investments Receivables (ST) ventories Other Current Assets otal Current Assets Gross Property Plant & Equip Accumulated Depreciation let Property Plant & Equip ong Term Investments ntangible Assets Other Assets otal Assets Accounts Payable & Accrued Exps Accounts Payable Accrued Expenses Current Debt Other Current Liabilities otal Current Liabilities T Debt & Leases Deferred LT Liabilities linority Interests Other Liabilities otal Liabilities Common Share Capital Additional Paid-In Capital Retained Earnings Accum Other Comprehensive Income Treasury Stock Other Equity Total Equity Cotal Liabilities & Equity Yes Thousands 4305800 4305800 1828500 50100 611500 6795900 41423700 16995000 24428700 1171400 2744200 17586800 52727000 2365600 772600 1593000 500000 2230000 5095600 34628000 4645200 0 14033200 58402000 16600 8125800 55897700 -2663200 67051900 0 -5675000 52727000 Yes Thousands 3683800 3683800 2391800 44200 616300 6736100 40088600 15870300 24218300 1283300 2715800 15745800 50699300 1285800 689000 596800 2688800 2305600 6280200 35143400 4060300 0 13687500 59171400 16600 7854700 53492500 -2758800 67077100 0 -8472100 50699300 andardized Quarterly Income Statement -port Date 09/30/2021 3rd Quarter USD Not Qualified 09/30/2020 3rd Quarter USD Not Qualified urrency dit Status nsolidated cale les Revenue ner Revenue tal Revenue rect Costs oss Profit elling General & Admin preciation & Amortization estruct Remediation & Impair ner Operating Expense tal Indirect Operating Costs erating Income erest Income ins on Sale of Assets her Non-Operating Income tal Non-Operating Income rnings Before Tax xation quity Earnings traordinary Items counting Changes t Income eference Dividends & Similar et Income to Common erage Shares Basic PS Net Basic S Continuing Basic erage Shares Diluted PS Net Diluted PS Continuing Diluted lares Outstanding Yes Thousands 2598400 3602900 6201300 2108400 4092900 1152200 84100 -106400 63300 1193200 2899700 -291400 37800 3700 -257300 2642400 541500 49000 0 0 2149900 0 2149900 747100 2.88 2.88 752600 Yes Thousands 2286400 3131700 5418100 1876300 3541800 1022600 75800 -138700 105100 1064800 2477000 -306700 700 -2600 -308600 2168400 454500 48700 0 0 1762600 0 1762600 744500 2.37 2.37 2.86 750000 2.35 2.35 745110.988 2.86 747245.427 Exchange rate used is that of the Year End reported date Standardized Quarterly Cumulative CF Report Date 09/30/2021 3rd Quarter USD Not Qualified 09/30/2020 3rd Quarter USD Not Qualified Currency Audit Status Yes Thousands 5906400 703400 Yes Thousands 3353300 1521900 Consolidated Scale Het Income (Cumu) Adjustments from Inc to Cash (Cumu) Change in Working Capital (Cumu) Other Operating Cash Flows (Cumu) Cash Flow from Operations (Cumu) Purchase of Pty Plant & Equip (Cumu) Proceeds from Pty Plant & Equip(Cumu) Change in Business Activities (Cumu) Other Investing Cash Flows (Cumu) Cash Flow from Investing (Cumu) Change in ST Debt (Cumu) Change in LT Debt (Cumu) Change in Equity (Cumu) Payment of Dividends (Cumu) Other Financing Cash Flows (Cumu) Cash Flow from Financing (Cumu) Effect of Exchange Rate (Cumu) Change in Cash (Cumu) Opening Cash (Cumu) Closing Cash Depn & Amortn (CF) (Cumu) Het Purch of Pty Plant & Equip (Cumu) -134800 6475000 -1352800 97900 25200 186700 -1043000 7600 -1739400 156400 -2889500 32700 -4497600 -77700 856700 3449100 4305800 1386500 -1254900 -602800 4272400 -1177700 17800 -14500 -8500 -1182900 -885700 4128900 -643300 -2791300 -122000 -313400 9200 2785300 898500 3683800 1287100 -1159900 CURRENT RATIO (Current Assets / Current Liabilities) TOTAL ASSET TURNOVER RATIO (Total Revenue / Total Assets) Current Assets Total Revenue 6795900 5095600 Current Liabilities 1.333680038 Total Assets #DIV/0! WORKING CAPITAL (Current Assets - Current Liabilities) FINANCIAL LEVERAGE (Total Assets / Shareholder's Equity) Current Assets Total Assets 6795900 5095600 Current Liabilities 1700300 Shareholder's Equity #DIV/0! DEBT RATIO (Total Debt / Total Assets) NET PROFIT MARGIN (Net Income / Total Revenue) Total Debt Net Income Total Assets Total Revenue #DIV/0! EARNINGS PER SHARE (Net Income / Weighted Average Common Shares Outstanding) RETURN ON ASSETS (Net Income / Total Assets) Net Income Net Income Shares Outstanding #DIV/0! Total Assets #DIV/0! PRICE EARNINGS RATIO (Share Price (end of quarter / EPS) RETURN ON EQUITY (Net Income - Preferred Dividends / Shareholder's Equity) Stock Price EPS #DIV/0! NI - Pref. Div. Shareholder's Equity #DIV/0
Step by Step Solution
There are 3 Steps involved in it

Get step-by-step solutions from verified subject matter experts