

Question: In Python 2.7 please show the coding steps for: You should be able to run it as python P3.py 1 2.5 5, which will generate
In Python 2.7 please show the coding steps for: 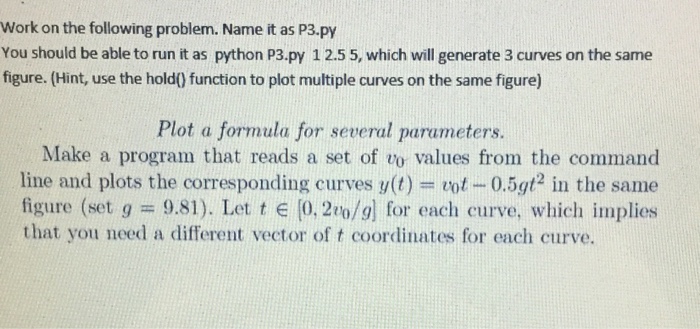
You should be able to run it as python P3.py 1 2.5 5, which will generate 3 curves on the same figure. Plot a formula for several parameters. Make a program that reads a set of v_0 values from the command line and plots the corresponding curves y(t) = v_0 t - 0.5 gt^2 in the same figure (set g = 9.81). Let t element [0, 2v_0/g] for each curve, which implies that you need a different vector of t coordinates for each curve
Step by Step Solution
There are 3 Steps involved in it
1 Expert Approved Answer
Step: 1 Unlock

Question Has Been Solved by an Expert!
Get step-by-step solutions from verified subject matter experts
Step: 2 Unlock
Step: 3 Unlock