

Question: In Python! I reduced the same list down tremendously, but just wanted to get a general idea of a concept. After a biopsy of a
In Python! I reduced the same list down tremendously, but just wanted to get a general idea of a concept.
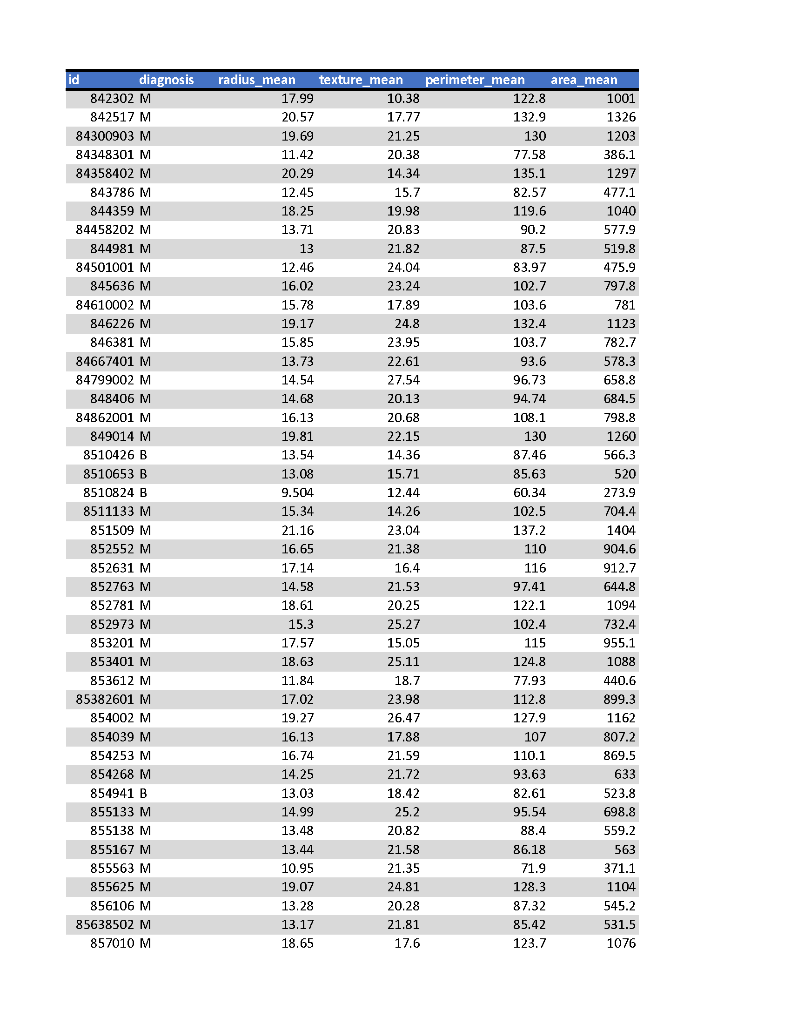
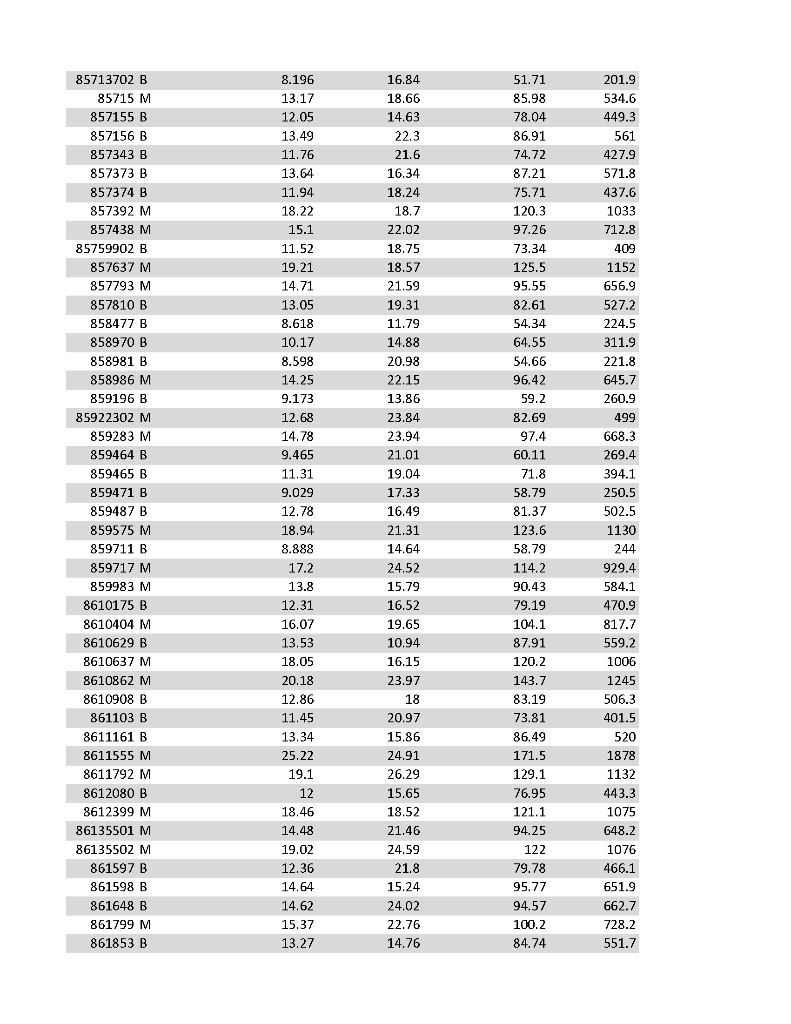
After a biopsy of a tumor tissue tests are run on the tumor cells to determine a diagnosis of benign or malignant. The tests result in 30 different cell attribute measurement values. Some or the measured aspects are radius_mean, perimeter_mean, area_mean which measure the mean value of cell radius (distance from center point), perimeter, and area. Looking at the web page and the data set you can see the other 27 different values. Based on these 30 values, a formula is applied to determine with there tumor is malignant or benign. Note, the first column is the sample id. The second column is the diagnosis for the sample, where M means malignant and B means benign. At lunch one day, you and a medical technician come up with the idea that all this data and complicated formula are not needed. Instead, you decide you just need to look at the first four metrics {radius, texture, perimeter, area} means.
The process is as follows:
a) strip the data to only consider those 4 values
b) Create four data files:
q3_gte_13: third attribute - those data samples whose radius value is >= 13
q4_gte_18: fourth attribute - those data samples whose texture value is >= 18
q5_gte_85: fifth attribute - those data samples whose perimeter value is >= 85
q6_gte_500: sixth attribute - those data samples whose area value is >= 500
c) Find the data ids that are in each of these four files. The idea is that if a data sample exceeds the threshold (13, 18, 85, and 500) for each of these 4 attributes then the tumor is malignant. If the data does not exceed any of these attributes, then the tumor is benign. If the tumor exceeds some, but not all, of these thresholds then the tumor could be either benign or malignant.
To do this, you need to take the intersection of 4 files where the files have the ids of these data sets.
The four files (q3_gte_13, q4_gte_18, q5_gte_85, q6_gte_500) also have the diagnosis of B or M from the original test included. You want to test the quality of your process.
To do this create 2 versions for each of the 4 dimensions: q3_B, q3_M
Where B means the data has been diagnosed as Benign and M means it was diagnosed as Malignant.
Likewise for columns 4, 5, and 6 giving files:
q4_B,
q4_M
q5_B,
q5_M
q6_B,
q6_M
Let file NewResult contain the intersection of ids from the four files (q3_gte_13, q4_gte_18, q5_gte_85, q6_gte_500), i.e. regardless of whether the original methods said M or B. Compare NewResult to the data found in the 4 files you created of ids of M data: q3_M, q4_M, q5_M, and q6_M. Let SubsetMResult contain the data that is the union of the four files (q3_M, q4_M, q5_M, and q6_M).
Then, calculate: Difference_1 = SubsetMResult - NewResult If your new method is capture all the same data, then Difference should be the empty set.
Sort difference 1
Written Responses:
What is the proportion of observations in Original Result with DIAGNOSIS = M?
What is the length of SubsetMResult and NewResult?
Step by Step Solution
There are 3 Steps involved in it

Get step-by-step solutions from verified subject matter experts