

Question: In Python: machine learning homework for regression I have provided the data set and part of the code. I hope you can help me with
In Python: machine learning homework for regression
I have provided the data set and part of the code. I hope you can help me with Problem 4. Thank you!
Here is the data set and code for previous question, which is relevant with Problem 4.
==============Code Chunk==================
from sklearn.linear_model import LinearRegression import pandas as pd import pylab as plt import seaborn import numpy.random as nprnd import random
%matplotlib inline
# Import data df = pd.read_csv('http://www-bcf.usc.edu/~gareth/ISL/Advertising.csv', index_col=0) df.head()
==============Code Chunk==================
 ==============Code Chunk==================
from sklearn.linear_model import LinearRegression from sklearn.model_selection import train_test_split
# Set y to be the sales in df y = df['sales']
# Set X to be just the features described above in df, also create a new column called interecept which is just 1. X = df.drop(['sales'],1)
# Randomly split data into training and testing - 80% training, 20% testing. X_train, X_test, y_train, y_test = train_test_split(X, y, test_size=0.2, random_state=42)
# Create linear regression object regr = LinearRegression()
# Train the model using the training sets regr.fit(X_train, y_train)
# The coefficients print('Coefficients: ', regr.coef_)
# The mean square error print("Residual sum of squares: %.2f" % np.mean((regr.predict(X_test) - y_test) ** 2))
# Explained variance score: 1 is perfect prediction print('R^2 Score: %.2f' % regr.score(X_test, y_test)) ==============Code Chunk==================
Please provide relevant answers and Python code. (Screenshots of your Jupyter Notebook are okay!!! )
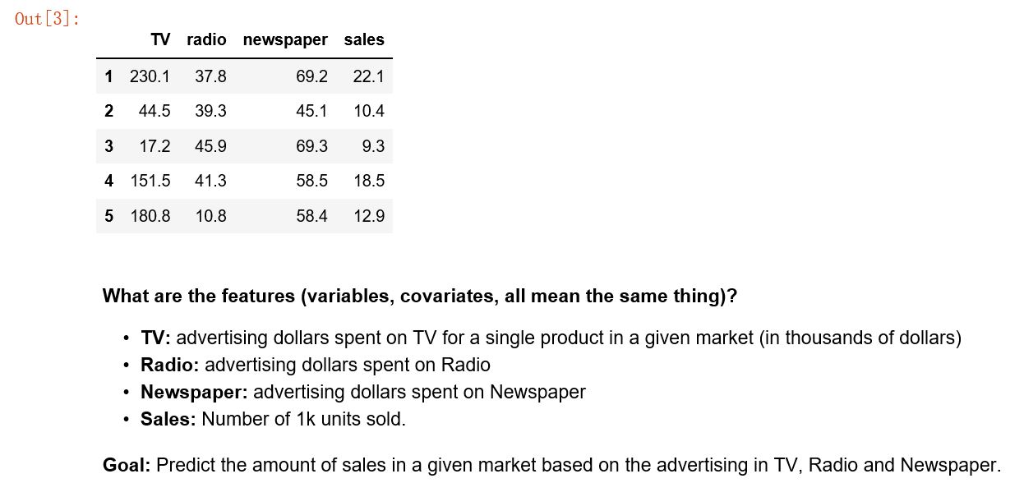
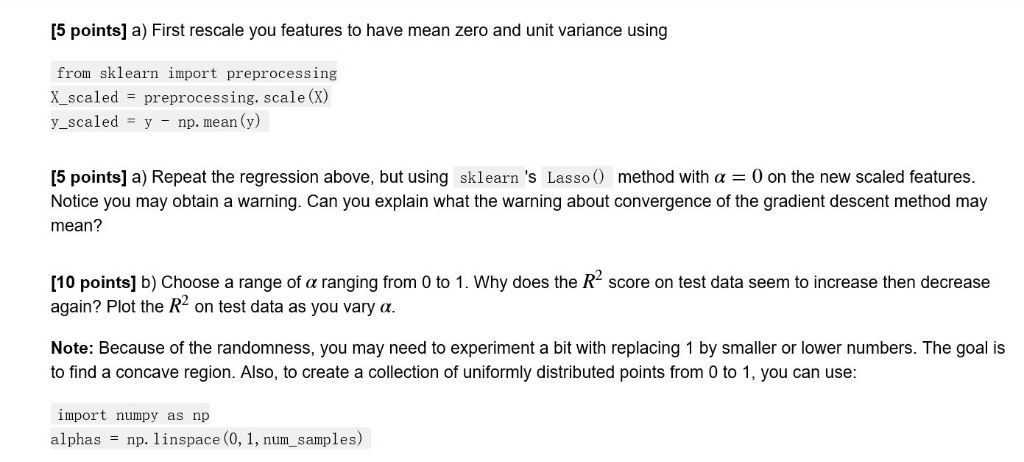
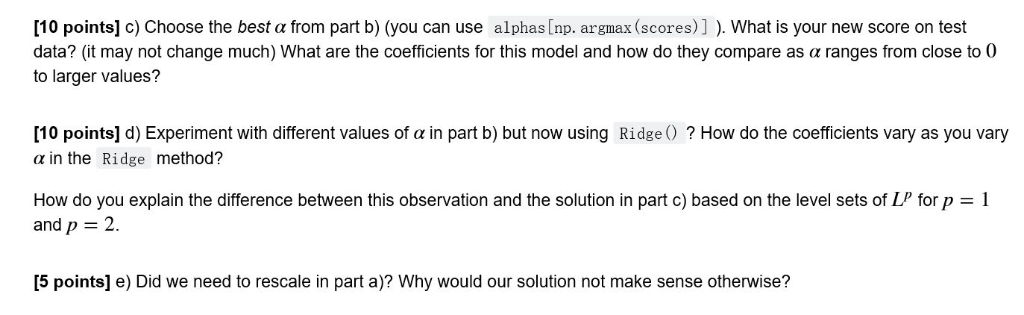
Out [3]: 1 230.1 37.8 2 44.5 39.3 3 17.2 45.9 4 151.5 41.3 5 180.8 10.8 TV radio newspaper sales 69.2 22.1 45.1 10.4 69.3 9.3 58.5 18.5 58.4 12.9 What are the features (variables, covariates, all mean the same thing)? TV: advertising dollars spent on TV for a single product in a given market (in thousands of dollars) Radio: advertising dollars spent on Radio Newspaper: advertising dollars spent on Newspaper . Sales: Number of 1k units sold Goal: Predict the amount of sales in a given market based on the advertising in TV, Radio and Newspaper. [5 points] a) First rescale you features to have mean zero and unit variance using from sklearn import preprocessing X_scaled preprocessing. scale (x) y_scaled y - np. mean (y) [5 points] a) Repeat the regression above, but using ski earn 's Lasso() method with = 0 on the new scaled features. Notice you may obtain a warning. Can you explain what the warning about convergence of the gradient descent method may mean? [10 points] b) Choose a range of ranging from 0 to 1 . Why does the R2 score on test data seem to increase then decrease again? Plot the R2 on test data as you vary a. Note: Because of the randomness, you may need to experiment a bit with replacing 1 by smaller or lower numbers. The goal is to find a concave region. Also, to create a collection of uniformly distributed points from 0 to 1, you can use: import numpy as np alphas np. linspace (0, 1, num_samples) [10 points] c) Choose the best from part b) (you can use alphas [np, argmax (scores) ] ). What is your new score on test data? (it may not change much) What are the coefficients for this model and how do they compare as a ranges from close to 0 to larger values? [10 points] d) Experiment with different values of a in part b) but now using Ridge ? How do the coefficients vary as you vary a in the Ridge method? How do you explain the difference between this observation and the solution in part c) based on the level sets of LP for P = 1 and p 2. [5 points] e) Did we need to rescale in part a)? Why would our solution not make sense otherwise? Out [3]: 1 230.1 37.8 2 44.5 39.3 3 17.2 45.9 4 151.5 41.3 5 180.8 10.8 TV radio newspaper sales 69.2 22.1 45.1 10.4 69.3 9.3 58.5 18.5 58.4 12.9 What are the features (variables, covariates, all mean the same thing)? TV: advertising dollars spent on TV for a single product in a given market (in thousands of dollars) Radio: advertising dollars spent on Radio Newspaper: advertising dollars spent on Newspaper . Sales: Number of 1k units sold Goal: Predict the amount of sales in a given market based on the advertising in TV, Radio and Newspaper. [5 points] a) First rescale you features to have mean zero and unit variance using from sklearn import preprocessing X_scaled preprocessing. scale (x) y_scaled y - np. mean (y) [5 points] a) Repeat the regression above, but using ski earn 's Lasso() method with = 0 on the new scaled features. Notice you may obtain a warning. Can you explain what the warning about convergence of the gradient descent method may mean? [10 points] b) Choose a range of ranging from 0 to 1 . Why does the R2 score on test data seem to increase then decrease again? Plot the R2 on test data as you vary a. Note: Because of the randomness, you may need to experiment a bit with replacing 1 by smaller or lower numbers. The goal is to find a concave region. Also, to create a collection of uniformly distributed points from 0 to 1, you can use: import numpy as np alphas np. linspace (0, 1, num_samples) [10 points] c) Choose the best from part b) (you can use alphas [np, argmax (scores) ] ). What is your new score on test data? (it may not change much) What are the coefficients for this model and how do they compare as a ranges from close to 0 to larger values? [10 points] d) Experiment with different values of a in part b) but now using Ridge ? How do the coefficients vary as you vary a in the Ridge method? How do you explain the difference between this observation and the solution in part c) based on the level sets of LP for P = 1 and p 2. [5 points] e) Did we need to rescale in part a)? Why would our solution not make sense otherwise
Step by Step Solution
There are 3 Steps involved in it

Get step-by-step solutions from verified subject matter experts