

Question: Python!!! Python programming homework and Interpretation I have provided the original dataset, and part of the data. I hope that you can help me with
Python!!! Python programming homework and Interpretation
I have provided the original dataset, and part of the data. I hope that you can help me with Question d_1, d_2, f, g, h, i, j.
Thank you!
In this problem we will explore our first dataset using pandas (for loading and procssing our data) and sklearn (for building machine learning models).
==================Code Chunk======================
from sklearn.linear_model import LinearRegression import pandas as pd import pylab as plt import seaborn import numpy.random as nprnd import random %matplotlib inline df = pd.read_csv('http://www-bcf.usc.edu/~gareth/ISL/Advertising.csv', index_col=0) df.head()==================Code Chunk======================
Probelm : Predict sales using sklearn
- Split data into training and testing subsets.
- Train model using LinearRegression() from sklearn.linear_model on training data.
- Evaluate using RMSE and R^2 on testing set
====================Code Chunk==========================
from sklearn.linear_model import LinearRegression
# Set y to be the sales in df
y = df['sales']
# Set X to be just the features described above in df, also create a new column called interecept which is just 1.
X = df.drop(['sales'],1)
# Randomly split data into training and testing - 80% training, 20% testing.
from sklearn.model_selection import train_test_split X_train, X_test, y_train, y_test = train_test_split(X, y, test_size=0.2, random_state=42)
====================Code Chunk==========================

====================Code Chunk==========================
import numpy as np from mpl_toolkits.mplot3d import Axes3D import matplotlib.pyplot as plt
fig = plt.figure(figsize=(15,15)) ax = fig.add_subplot(111, projection='3d')
x_surf = np.arange(0, 300, 20) y_surf = np.arange(0, 60, 4) x_surf, y_surf = np.meshgrid(x_surf, y_surf)
new_x = pd.core.frame.DataFrame({'TV': x_surf.ravel(), 'radio': y_surf.ravel()}) # define your regr_1 predict_sales = regr_1.predict(new_x) ax.plot_surface(x_surf, y_surf, predict_sales.reshape(x_surf.shape), rstride=1, cstride=1, color='None', alpha = 0.4)
ax.scatter(X['TV'], X['radio'], y, c='r', marker='o')
ax.set_xlabel('TV') ax.set_ylabel("Radio") ax.set_zlabel('sales')
====================Code Chunk========================

Please provide python code and relevant answers. (Screenshots of your Jupyter Notebook are okay!!! )
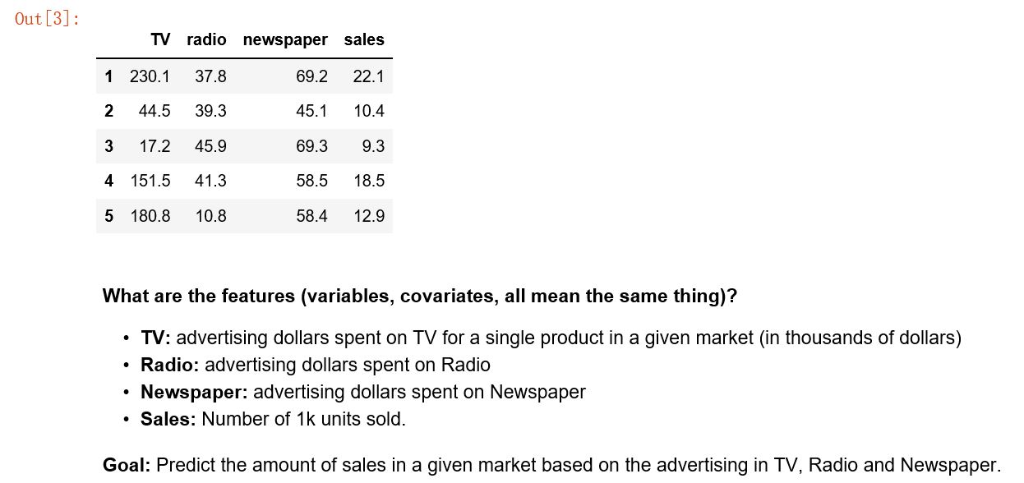
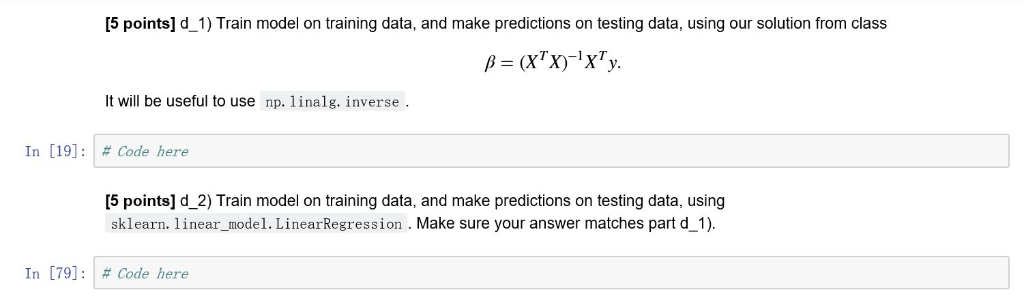
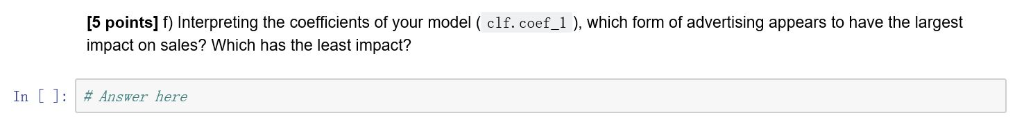
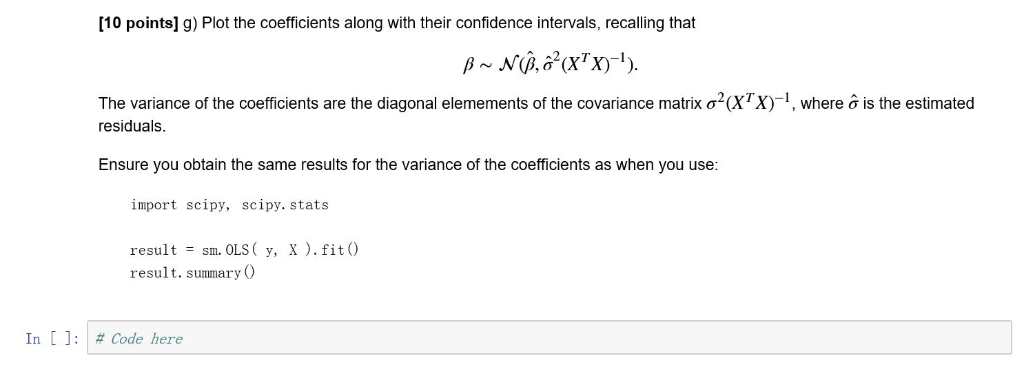
Out [3]: 1 230.1 37.8 2 44.5 39.3 3 17.2 45.9 4 151.5 41.3 5 180.8 10.8 TV radio newspaper sales 69.2 22.1 45.1 10.4 69.3 9.3 58.5 18.5 58.4 12.9 What are the features (variables, covariates, all mean the same thing)? TV: advertising dollars spent on TV for a single product in a given market (in thousands of dollars) Radio: advertising dollars spent on Radio Newspaper: advertising dollars spent on Newspaper . Sales: Number of 1k units sold Goal: Predict the amount of sales in a given market based on the advertising in TV, Radio and Newspaper. [5 points] d_1) Train model on training data, and make predictions on testing data, using our solution from class It will be useful to use np. 1linalg. inverse. In [19]: # Code here [5 points] d 2) Train model on training data, and make predictions on testing data, using sklearn. linear_model. LinearRegression . Make sure your answer matches part d 1) In [79]: # Code here [5 points] f Interpreting the coefficients of your model ( clf. coef_1 ), which form of advertising appears to have the largest impact on sales? Which has the least impact? In [ ] : # Answer here [10 points] g) Plot the coefficients along with their confidence intervals, recalling that The variance of the coefficients are the diagonal elemements of the covariance matrix 2(X residuals -1, where is the estimated Ensure you obtain the same results for the variance of the coefficients as when you use import scipy, scipy. stats result-sm. OLS ( y, X ), fit() result. summary O In [ ]: # Code here [10 points] i) (synnergetic effects) Try plotting the data in three dimensions along with the hyperplane solution to see where the solution you have stops following the linear trend, and see if you can infer a new variable which will help, which is a product of two of our current variables. More precisely, our previous model has been: See if you an introduce a new term for some j using your intuition from the previous problems. What is your interpretation of this result? ** Hint: The code below can be adopted to make your 3d plot.* [5 points] j) Does your mixed variable in i) imporve performance? Why? Out [3]: 1 230.1 37.8 2 44.5 39.3 3 17.2 45.9 4 151.5 41.3 5 180.8 10.8 TV radio newspaper sales 69.2 22.1 45.1 10.4 69.3 9.3 58.5 18.5 58.4 12.9 What are the features (variables, covariates, all mean the same thing)? TV: advertising dollars spent on TV for a single product in a given market (in thousands of dollars) Radio: advertising dollars spent on Radio Newspaper: advertising dollars spent on Newspaper . Sales: Number of 1k units sold Goal: Predict the amount of sales in a given market based on the advertising in TV, Radio and Newspaper. [5 points] d_1) Train model on training data, and make predictions on testing data, using our solution from class It will be useful to use np. 1linalg. inverse. In [19]: # Code here [5 points] d 2) Train model on training data, and make predictions on testing data, using sklearn. linear_model. LinearRegression . Make sure your answer matches part d 1) In [79]: # Code here [5 points] f Interpreting the coefficients of your model ( clf. coef_1 ), which form of advertising appears to have the largest impact on sales? Which has the least impact? In [ ] : # Answer here [10 points] g) Plot the coefficients along with their confidence intervals, recalling that The variance of the coefficients are the diagonal elemements of the covariance matrix 2(X residuals -1, where is the estimated Ensure you obtain the same results for the variance of the coefficients as when you use import scipy, scipy. stats result-sm. OLS ( y, X ), fit() result. summary O In [ ]: # Code here [10 points] i) (synnergetic effects) Try plotting the data in three dimensions along with the hyperplane solution to see where the solution you have stops following the linear trend, and see if you can infer a new variable which will help, which is a product of two of our current variables. More precisely, our previous model has been: See if you an introduce a new term for some j using your intuition from the previous problems. What is your interpretation of this result? ** Hint: The code below can be adopted to make your 3d plot.* [5 points] j) Does your mixed variable in i) imporve performance? Why
Step by Step Solution
There are 3 Steps involved in it

Get step-by-step solutions from verified subject matter experts