

Question: in python please 1 Part I: Historic change in city sizes In this first part, you will write a program to get some understanding of
in python please
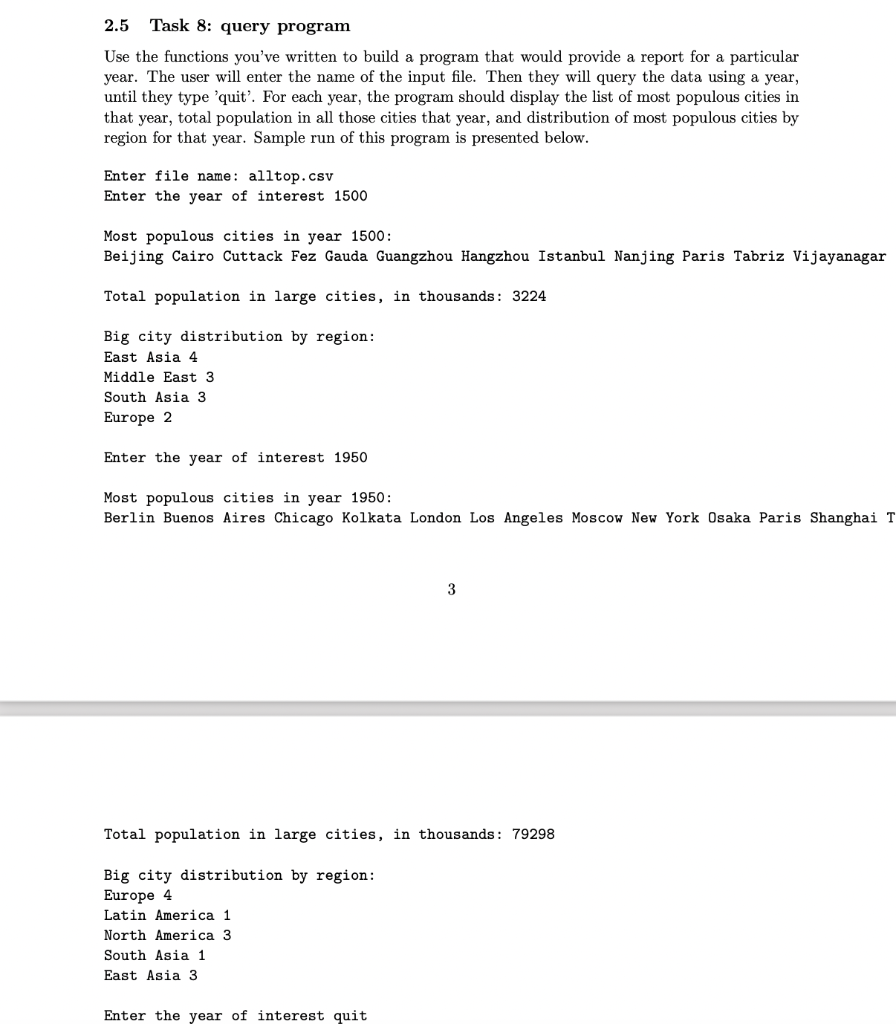
1 Part I: Historic change in city sizes In this first part, you will write a program to get some understanding of urban populations in a particular historic period. 1.1 Input file format In the tasks 0, 1, and 2, the input will come from the keyboard. In Tasks 3 and 4, the input will come from a file in simplified format: the file contains integer population sizes, one number per line. The title the file corresponds to the year that the data pertains to. 1.2 Task 0 Write a program that asks the user to enter a series of city populations (continuosly asking for a value until they type "quit) and outputs the the average city size. After you complete the program in Task 0, use it as a starting point to build programs for other tasks. 1 1.3 Task 1 Modify the program from Task 0 so that it reports a median of the city populations. The median function is in statistics Python module. The median is a more accurate characteristic of the list of cities, because the average might be skewed by a few very large cities or very small towns. Look up the concept of a median if you're not very familiar with it, also check Python documentation for how to use this function (https://docs.python.org/3/library/statistics.html). 1.4 Task 2 Modify the program from Task 0 so that the total population in all cities total population(1). This function takes as a parameter a list of city populations (integers) and returns the total popu- lation(integer). 1.5 Task 3 Modify the program from Task 0 so that it reads the input from the file, the name of the file will be provided by the user, and computes the average size of the city. 2.2 Task 5: get_unique_cities_count(filename) Some cities appear in the top most populous for several years in a row. We might be interested to know all cities that made it to the list without duplicates, and their quantity. This function takes a string containing the name of an input file as a parameter. It returns the total number of unique cities in the list. 2.3 Task 6: get_year_count(filename) This function takes a string containing the name of an input file as a parameter. It returns a dictionary where the keys are the cities and the values are how many years this city is present in the list. 2.4 Task 7: get_population by region(filename) We might be interested in a higher-level comparison, speaking about the regions of the world rather than individual cities. This function takes a string containing the name of an input file as a parameter. It returns a dictionary. They keys are regions ("Middle East, South Asia, North America, etc) found in the file. The values are the total populations of all cities in those regions. 2.5 Task 8: query program Use the functions you've written to build a program that would provide a report for a particular year. The user will enter the name of the input file. Then they will query the data using a year, until they type 'quit. For each year, the program should display the list of most populous cities in that year, total population in all those cities that year, and distribution of most populous cities by region for that year. Sample run of this program is presented below. Enter file name: alltop.csv Enter the year of interest 1500 Most populous cities in year 1500: Beijing Cairo Cuttack Fez Gauda Guangzhou Hangzhou Istanbul Nanjing Paris Tabriz Vijayanagar Total population in large cities, in thousands : 3224 Big city distribution by region: East Asia 4 Middle East 3 South Asia 3 Europe 2 Enter the year of interest 1950 Most populous cities in year 1950: Berlin Buenos Aires Chicago Kolkata London Los Angeles Moscow New York Osaka Paris Shanghai T 3 Total population in large cities, in thousands : 79298 Big city distribution by region: Europe 4 Latin America 1 North America 3 South Asia 1 East Asia 3 Enter the year of interest quit 1.6 Task 4 Compose the program that possesses all the above functionality. It should ask the user for the name of the file (where city populations are located, one number per line) and report the number of cities, total population in all those cities calculated by total population (1) function, median population returned from statistics Python module. Run this program on a few available files and notice the change in values and scale through history. 2 Part II: Regional trends 2.1 Input file format Files are stored as .csv (comma-separated values), a very common data sharing format. You can open it with text editor such as TextEdit to view "raw" data, essentially rows of values separated by commas. Or you can open it with Excel/Numbers/Google Sheets to see the same data in a different way, nicely formatted by columns. The files all start with a header line followed by a line for each listing. For the questions in this assignment, the data of interest is in the columns with the headers: year city country population region 2
Step by Step Solution
There are 3 Steps involved in it

Get step-by-step solutions from verified subject matter experts