

Question: In Python. Please dont copy/paste previous answers. If you can explain a little that would be helpful too. Exercise 6.3 (5 points) In statistical physics
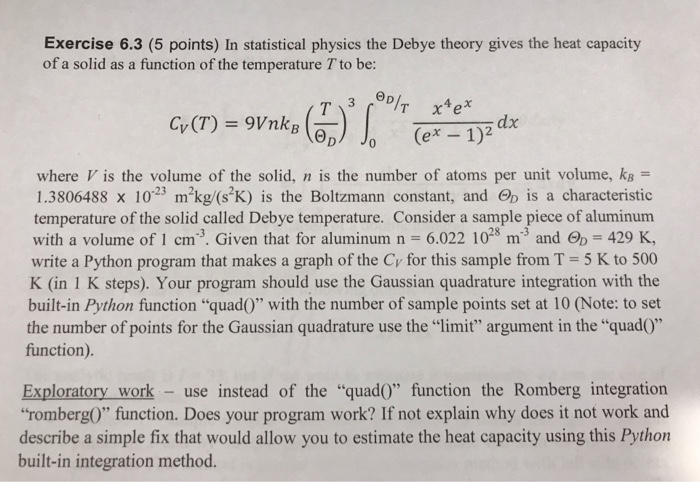
Exercise 6.3 (5 points) In statistical physics the Debye theory gives the heat capacity of a solid as a function of the temperature T to be: Jo (ex-1)2 where V is the volume of the solid, n is the number of atoms per unit volume, kB 1.3806488 x 10⁻²³ mrkg(sh) is the Boltzmann constant, and @p s a characteristic temperature of the solid called Debye temperature. Consider a sample piece of aluminum with a volume of 1 cm3. Given that for aluminum n 6.022 1028 m3 and Op-429 K, write a Python program that makes a graph of the Cy for this sample from T 5 K to 500 K (in 1 K steps). Your program should use the Gaussian quadrature integration with the built-in Python function "quadO" with the number of sample points set at 10 (Note: to set the number of points for the Gaussian quadrature use the "limit" argument in the "quadO" function) Exploratory work - use instead of the "quad0" function the Romberg integration "rombergO" function. Does your program work? If not explain why does it not work and describe a simple fix that would allow you to estimate the heat capacity using this Python built-in integration method
Step by Step Solution
There are 3 Steps involved in it

Get step-by-step solutions from verified subject matter experts