

Question: IN PYTHON Problem 8 : Trends by Country In this exercise, we will create line plots representing the change in population and life expectancy for
IN PYTHON Problem : Trends by Country
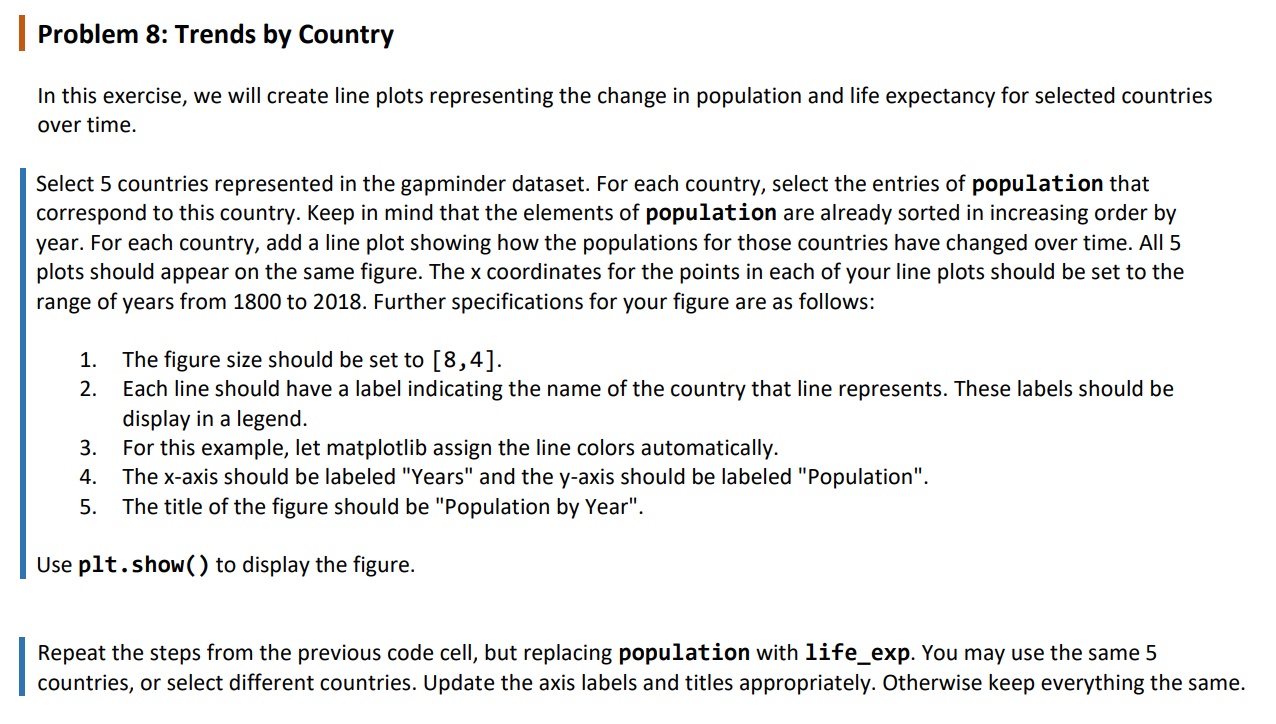
In this exercise, we will create line plots representing the change in population and life expectancy for selected countries
over time.
Select countries represented in the gapminder dataset. For each country, select the entries of population that
correspond to this country. Keep in mind that the elements of population are already sorted in increasing order by
year. For each country, add a line plot showing how the populations for those countries have changed over time. All
plots should appear on the same figure. The coordinates for the points in each of your line plots should be set to the
range of years from to Further specifications for your figure are as follows:
The figure size should be set to
Each line should have a label indicating the name of the country that line represents. These labels should be
display in a legend.
For this example, let matplotlib assign the line colors automatically.
The axis should be labeled "Years" and the axis should be labeled "Population".
The title of the figure should be "Population by Year".
Use pltshow to display the figure.
Repeat the steps from the previous code cell, but replacing population with lifeexp. You may use the same
countries, or select different countries. Update the axis labels and titles appropriately. Otherwise keep everything the same.Problem : Trends by Country
In this exercise, we will create line plots representing the change in population and life expectancy for selected countries
over time.
Select countries represented in the gapminder dataset. For each country, select the entries of population that
correspond to this country. Keep in mind that the elements of population are already sorted in increasing order by
year. For each country, add a line plot showing how the populations for those countries have changed over time. All
plots should appear on the same figure. The x coordinates for the points in each of your line plots should be set to the
range of years from to Further specifications for your figure are as follows:
The figure size should be set to
Each line should have a label indicating the name of the country that line represents. These labels should be
display in a legend.
For this example, let matplotlib assign the line colors automatically.
The xaxis should be labeled "Years" and the yaxis should be labeled "Population".
The title of the figure should be "Population by Year".
Use pltshow to display the figure.
Repeat the steps from the previous code cell, but replacing population with lifeexp. You may use the same
countries, or select different countries. Update the axis labels and titles appropriately. Otherwise keep everything the same.
Step by Step Solution
There are 3 Steps involved in it
1 Expert Approved Answer
Step: 1 Unlock

Question Has Been Solved by an Expert!
Get step-by-step solutions from verified subject matter experts
Step: 2 Unlock
Step: 3 Unlock