

Question: IN R After you finish programming play_solo(), we will use it to perform a Monte Carlo study of the game Chutes and Ladders. We wish
IN R
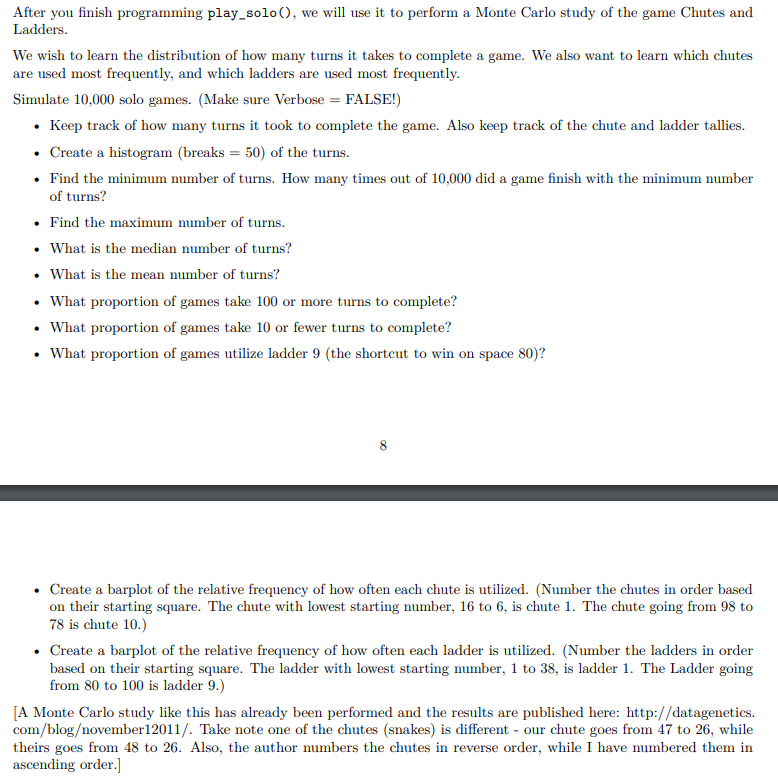
After you finish programming play_solo(), we will use it to perform a Monte Carlo study of the game Chutes and Ladders. We wish to learn the distribution of how many turns it takes to complete a game. We also want to learn which chutes are used most frequently, and which ladders are used most frequently. Simulate 10,000 solo games. (Make sure Verbose = FALSE!) Keep track of how many turns it took to complete the game. Also keep track of the chute and ladder tallies. Create a histogram (breaks = 50) of the turns. Find the minimum number of turns. How many times out of 10,000 did a game finish with the minimum number of turns? Find the maximum number of turns. What is the median number of turns? What is the mean number of turns? What proportion of games take 100 or more turns to complete? What proportion of games take 10 or fewer turns to complete? What proportion of games utilize ladder 9 (the shortcut to win on space 80)? Create a barplot of the relative frequency of how often each chute is utilized. (Number the chutes in order based on their starting square. The chute with lowest starting number, 16 to 6, is chute 1. The chute going from 98 to 78 is chute 10.) Create a barplot of the relative frequency of how often each ladder is utilized. (Number the ladders in order based on their starting square. The ladder with lowest starting number, 1 to 38, is ladder 1. The Ladder going from 80 to 100 is ladder 9.) [A Monte Carlo study like this has already been performed and the results are published here: http://datagenetics. com/blogovember12011/. Take note one of the chutes (snakes) is different - our chute goes from 47 to 26, while theirs goes from 48 to 26. Also, the author numbers the chutes in reverse order, while I have numbered them in ascending order.] After you finish programming play_solo(), we will use it to perform a Monte Carlo study of the game Chutes and Ladders. We wish to learn the distribution of how many turns it takes to complete a game. We also want to learn which chutes are used most frequently, and which ladders are used most frequently. Simulate 10,000 solo games. (Make sure Verbose = FALSE!) Keep track of how many turns it took to complete the game. Also keep track of the chute and ladder tallies. Create a histogram (breaks = 50) of the turns. Find the minimum number of turns. How many times out of 10,000 did a game finish with the minimum number of turns? Find the maximum number of turns. What is the median number of turns? What is the mean number of turns? What proportion of games take 100 or more turns to complete? What proportion of games take 10 or fewer turns to complete? What proportion of games utilize ladder 9 (the shortcut to win on space 80)? Create a barplot of the relative frequency of how often each chute is utilized. (Number the chutes in order based on their starting square. The chute with lowest starting number, 16 to 6, is chute 1. The chute going from 98 to 78 is chute 10.) Create a barplot of the relative frequency of how often each ladder is utilized. (Number the ladders in order based on their starting square. The ladder with lowest starting number, 1 to 38, is ladder 1. The Ladder going from 80 to 100 is ladder 9.) [A Monte Carlo study like this has already been performed and the results are published here: http://datagenetics. com/blogovember12011/. Take note one of the chutes (snakes) is different - our chute goes from 47 to 26, while theirs goes from 48 to 26. Also, the author numbers the chutes in reverse order, while I have numbered them in ascending order.]
Step by Step Solution
There are 3 Steps involved in it

Get step-by-step solutions from verified subject matter experts