

Question: In R ties. re good 12. Normal Sampling with Both Parameters Unknown The heights in inches of 20 college women were collected, observing the following
In R
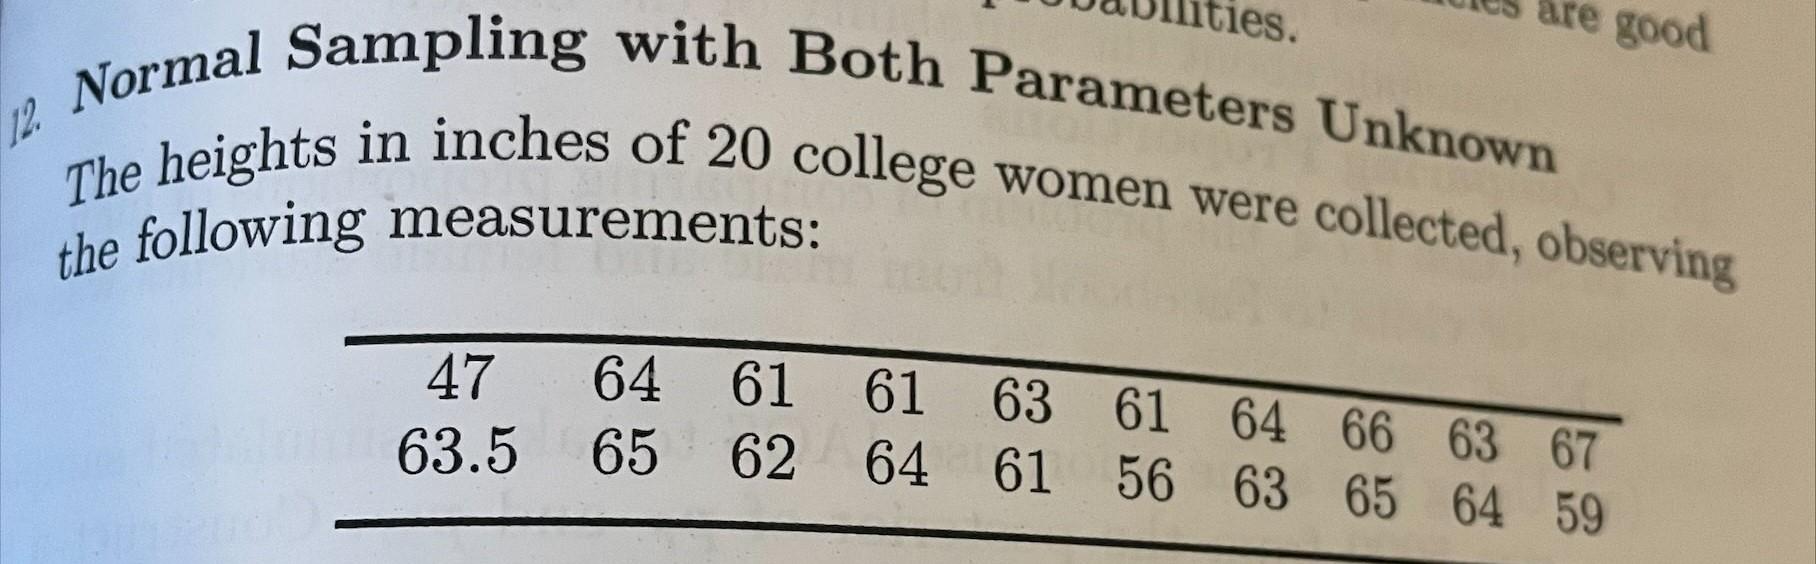
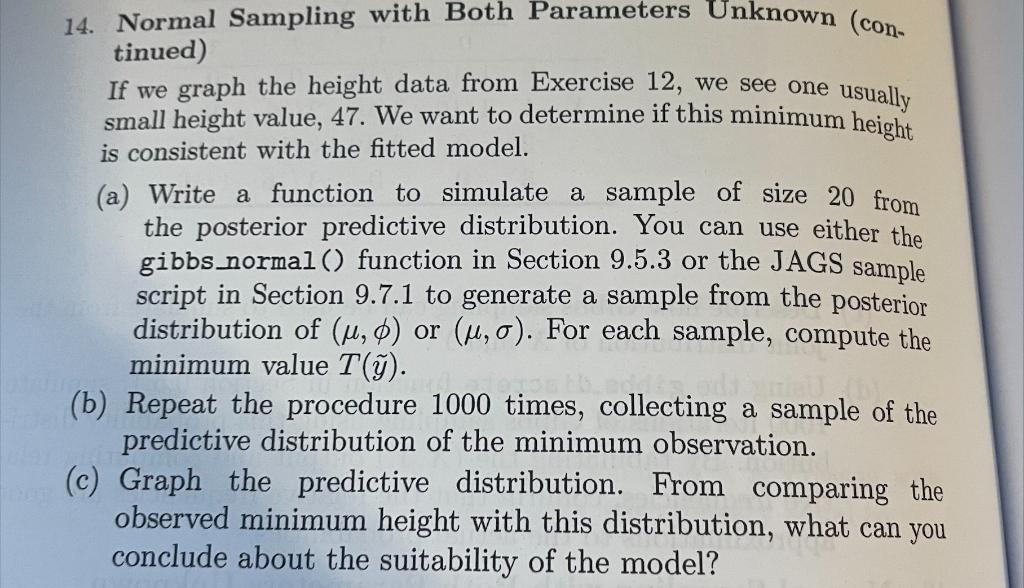
ties. re good 12. Normal Sampling with Both Parameters Unknown The heights in inches of 20 college women were collected, observing the following measurements: 47 64 61 61 63 61 64 66 63 67 63.5 65 62 64 61 56 63 65 64 59 usually 14. Normal Sampling with Both Parameters Unknown (con- tinued) If we graph the height data from Exercise 12, we see one small height value, 47. We want to determine if this minimum height is consistent with the fitted model. (a) Write a function to simulate a sample of size 20 from the posterior predictive distribution. You can use either the gibbs_normal() function in Section 9.5.3 or the JAGS sample script in Section 9.7.1 to generate a sample from the posterior distribution of (u,0) or (u, o). For each sample, compute the minimum value T(). (b) Repeat the procedure 1000 times, collecting a sample of the predictive distribution of the minimum observation. (c) Graph the predictive distribution. From comparing the observed minimum height with this distribution, what can you conclude about the suitability of the model? ties. re good 12. Normal Sampling with Both Parameters Unknown The heights in inches of 20 college women were collected, observing the following measurements: 47 64 61 61 63 61 64 66 63 67 63.5 65 62 64 61 56 63 65 64 59 usually 14. Normal Sampling with Both Parameters Unknown (con- tinued) If we graph the height data from Exercise 12, we see one small height value, 47. We want to determine if this minimum height is consistent with the fitted model. (a) Write a function to simulate a sample of size 20 from the posterior predictive distribution. You can use either the gibbs_normal() function in Section 9.5.3 or the JAGS sample script in Section 9.7.1 to generate a sample from the posterior distribution of (u,0) or (u, o). For each sample, compute the minimum value T(). (b) Repeat the procedure 1000 times, collecting a sample of the predictive distribution of the minimum observation. (c) Graph the predictive distribution. From comparing the observed minimum height with this distribution, what can you conclude about the suitability of the modelStep by Step Solution
There are 3 Steps involved in it
1 Expert Approved Answer
Step: 1 Unlock

Question Has Been Solved by an Expert!
Get step-by-step solutions from verified subject matter experts
Step: 2 Unlock
Step: 3 Unlock