

Question: In random order the standard deviations of the data displayed in each of the histograms above are 20, 10, 5 and 30. Your task is
In random order the standard deviations of the data displayed in each of the histograms above are 20, 10, 5 and 30. Your task is to study the histograms and then to match each histogram with its correct standard deviation ().Each standard deviation belongs to just one histogram. When you are confident with your answers then choose the correct choice below.
Histogram A:=10;Histogram B:=20;;Histogram C:=5;;Histogram D:=30
Histogram A:=10;;Histogram B:=20;;Histogram C:=30;;Histogram D:=5
Histogram A:=10;;Histogram B:=30;;Histogram C:=20;;Histogram D:=5
Histogram A:=20;;Histogram B:=5;;Histogram C:=30;;Histogram D:=10
Histogram A:=20;;Histogram B:=30;;Histogram C:=5;;Histogram D:=10
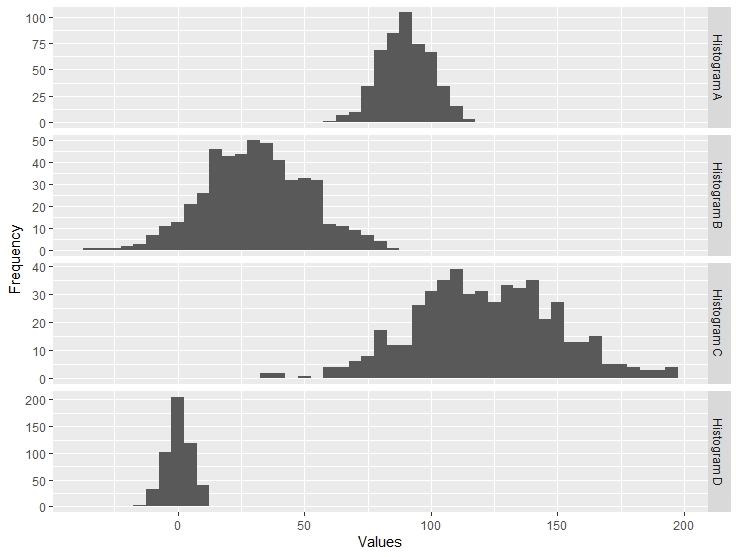
100 - 75 - 50 - Histogram A 25 - 0 - 50 - 40 - 30 - 20 - Histogram B 10 - 0 - Frequency 40 - 30 - 20 - Histogram C 10- 0 - 200 - 150 - 100 - Histogram D 50 - 0 - O 50 100 150 200 Values
Step by Step Solution
There are 3 Steps involved in it

Get step-by-step solutions from verified subject matter experts