

Question: In the above figure, the left hand side graph represents a perfectly competitive industry and the right hand side graph represents a perfectly competitive firm.
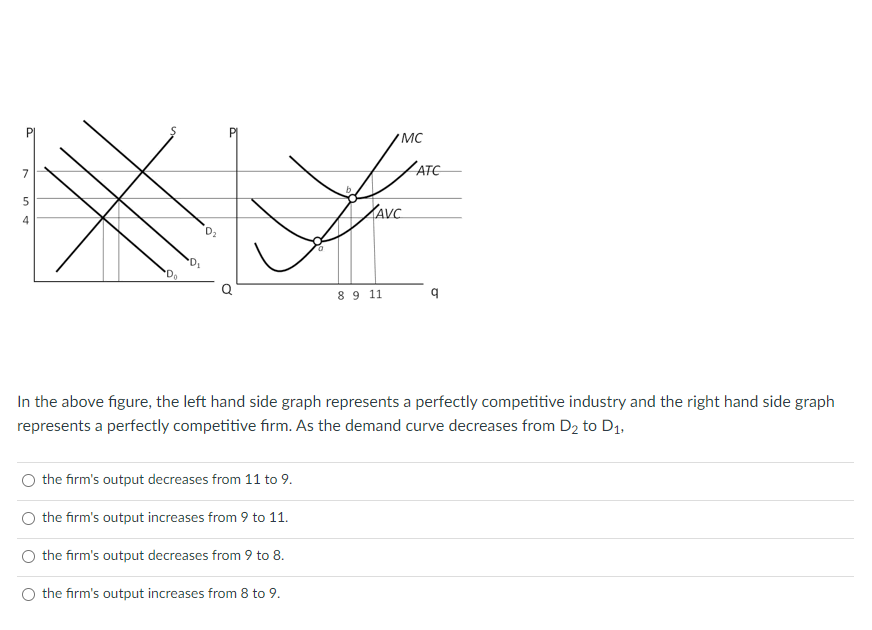
In the above figure, the left hand side graph represents a perfectly competitive industry and the right hand side graph represents a perfectly competitive firm. As the demand curve decreases from D2 to D1, O the firm's output decreases from 11 to 9. O the firm's output increases from 9 to 11. O the firm's output decreases from 9 to 8. O the firm's output increases from 8 to 9
Step by Step Solution
There are 3 Steps involved in it
1 Expert Approved Answer
Step: 1 Unlock

Question Has Been Solved by an Expert!
Get step-by-step solutions from verified subject matter experts
Step: 2 Unlock
Step: 3 Unlock