

Question: For the phase diagram below: The Vickers Hardness measurments of 3 different plain carbon steal samples are shown in the table below A) 0.25C (Air
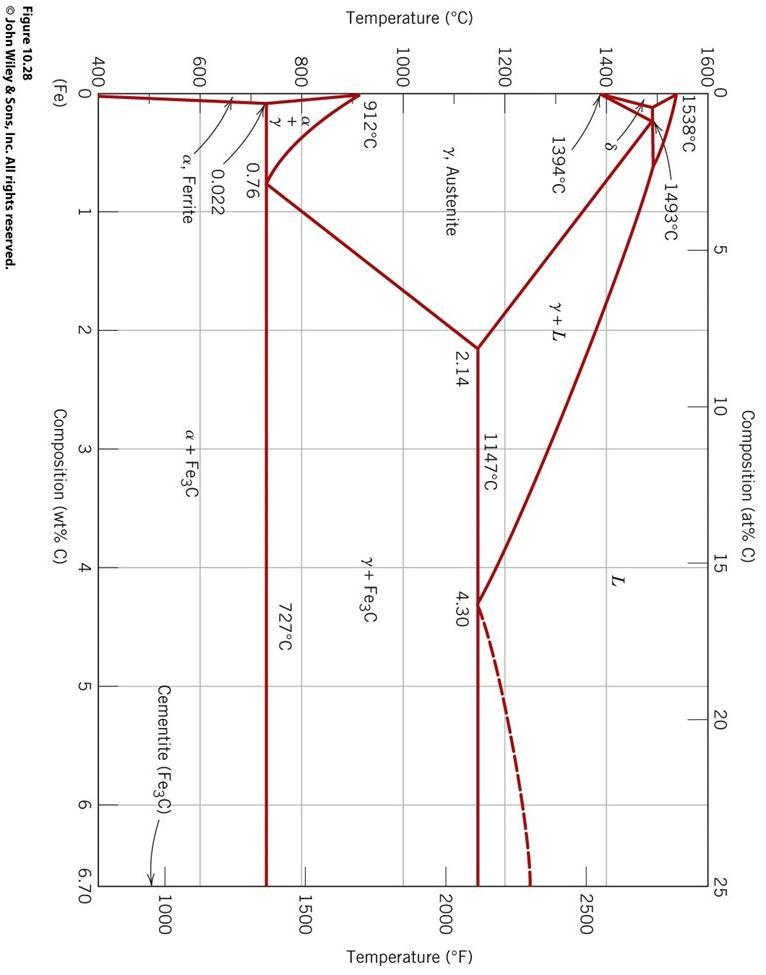
For the phase diagram below:
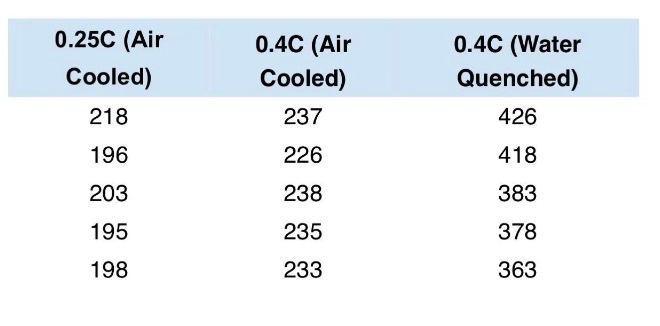
The Vickers Hardness measurments of 3 different plain carbon steal samples are shown in the table below
A) 0.25C (Air Cooled): Plain carbon steel with a low carbon content of 0.25 wt% that has been heated to ~ 950°C and cooled slowly in air
B) 0.4C (Air Cooled): Plain carbon steel with a higher carbon content of 0.4 wt% that has been heated to ~ 950°C and cooled slowly in air
C) 0.4C (Water Quenched) Plain carbon steel with a carbon content of 0.4 wt% that has been heated to 950°C and quenched in water.
Q6: For sample C (0.4C Water Quenched) , explain the difference in the hardness in terms of the difference in the relative amounts of the phases present in the microstructure.
- explain in terms of the microstructure why the hardness is higher than for the sample with the same carbon content that was cooled in air (Sample B).
- identify the mechanical property of steel that may be adversely affected by quenching.
Temperature (C) 0 1600 1400 1200 1000 800 600 400 1538C 0 (Fe) 912C + Y -1493C 1394C y, Austenite 0.76 0.022 a, Ferrite 5 Figure 10.28 John Wiley & Sons, Inc. All rights reserved. Y+L 2 2.14 Composition (at% C) 15 10 1147C a + Fe3C L 3 4 Composition (wt% C) 4.30 y+ Fe3C 727C 20 Cementite (Fe3C) 5 6 25 2500 2000 1500 1000 6.70 Temperature (F)
Step by Step Solution
There are 3 Steps involved in it
To understand the differences in hardness between the samples lets examine the microstructures resul... View full answer

Get step-by-step solutions from verified subject matter experts