

Question: In the below picture you can find a sequential decision tree with several alternatives. P1 to P10 represents the payoffs at the end of each
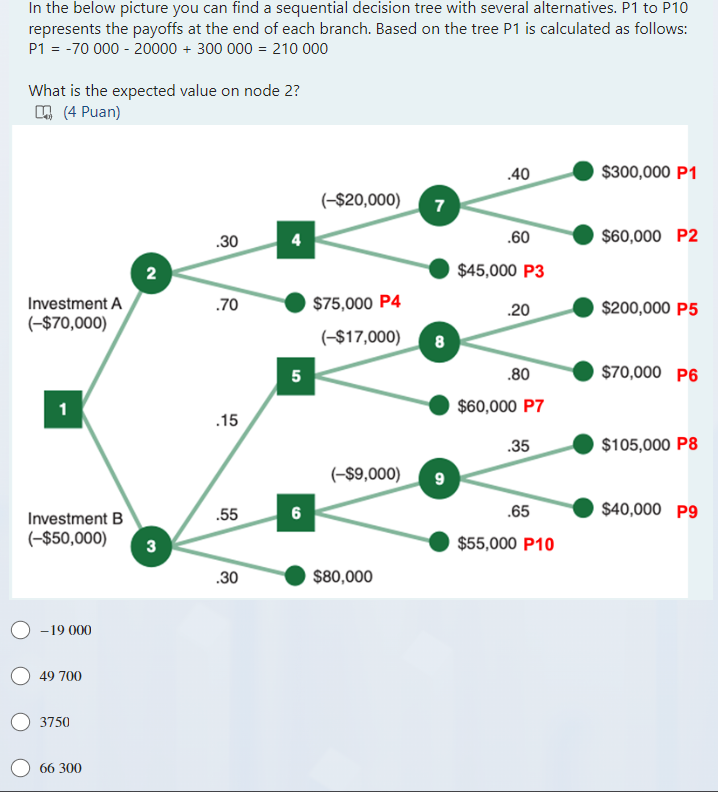
In the below picture you can find a sequential decision tree with several alternatives. P1 to P10 represents the payoffs at the end of each branch. Based on the tree P1 is calculated as follows: P1=7000020000+300000=210000 What is the expected value on node 2 ? (4 Puan) 19000 49700 3750 66300
Step by Step Solution
There are 3 Steps involved in it
1 Expert Approved Answer
Step: 1 Unlock

Question Has Been Solved by an Expert!
Get step-by-step solutions from verified subject matter experts
Step: 2 Unlock
Step: 3 Unlock