

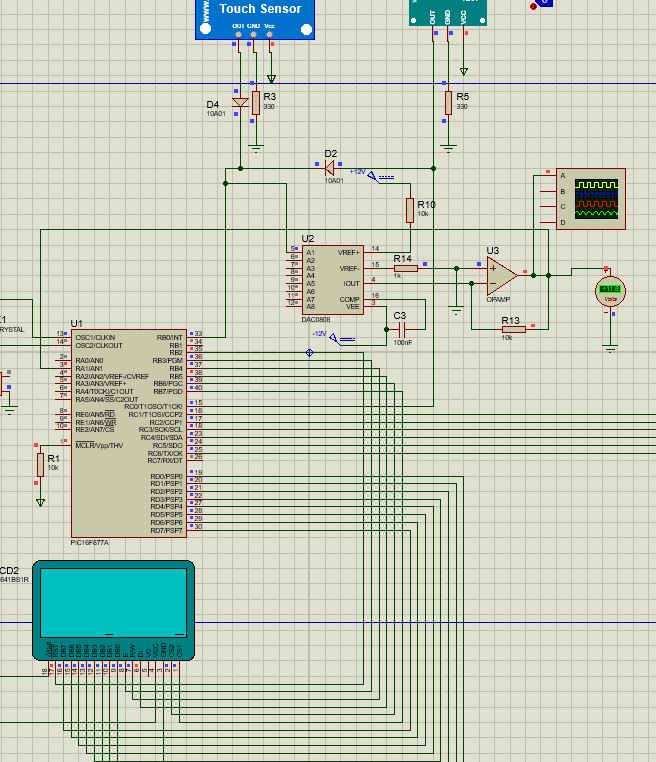
Question: In the circuit using the PIC 8 7 7 A , the sensor output is connected to the DAC. The digital sensor output, converted to
In the circuit using the PIC A the sensor output is connected to the DAC. The digital sensor output, converted to analog, is connected to the PICs A port, allowing the sensors analog output to be monitored as a graph. While graph libraries are readily available in Arduino, how can we plot a graph using the PIC?
Library used: #include
Max DAC Output Voltage: V
Min DAC Output Voltage: V
What is the function to plot graph the analog output on the GLCDCCS Compiler
Step by Step Solution
There are 3 Steps involved in it
1 Expert Approved Answer
Step: 1 Unlock

Question Has Been Solved by an Expert!
Get step-by-step solutions from verified subject matter experts
Step: 2 Unlock
Step: 3 Unlock