

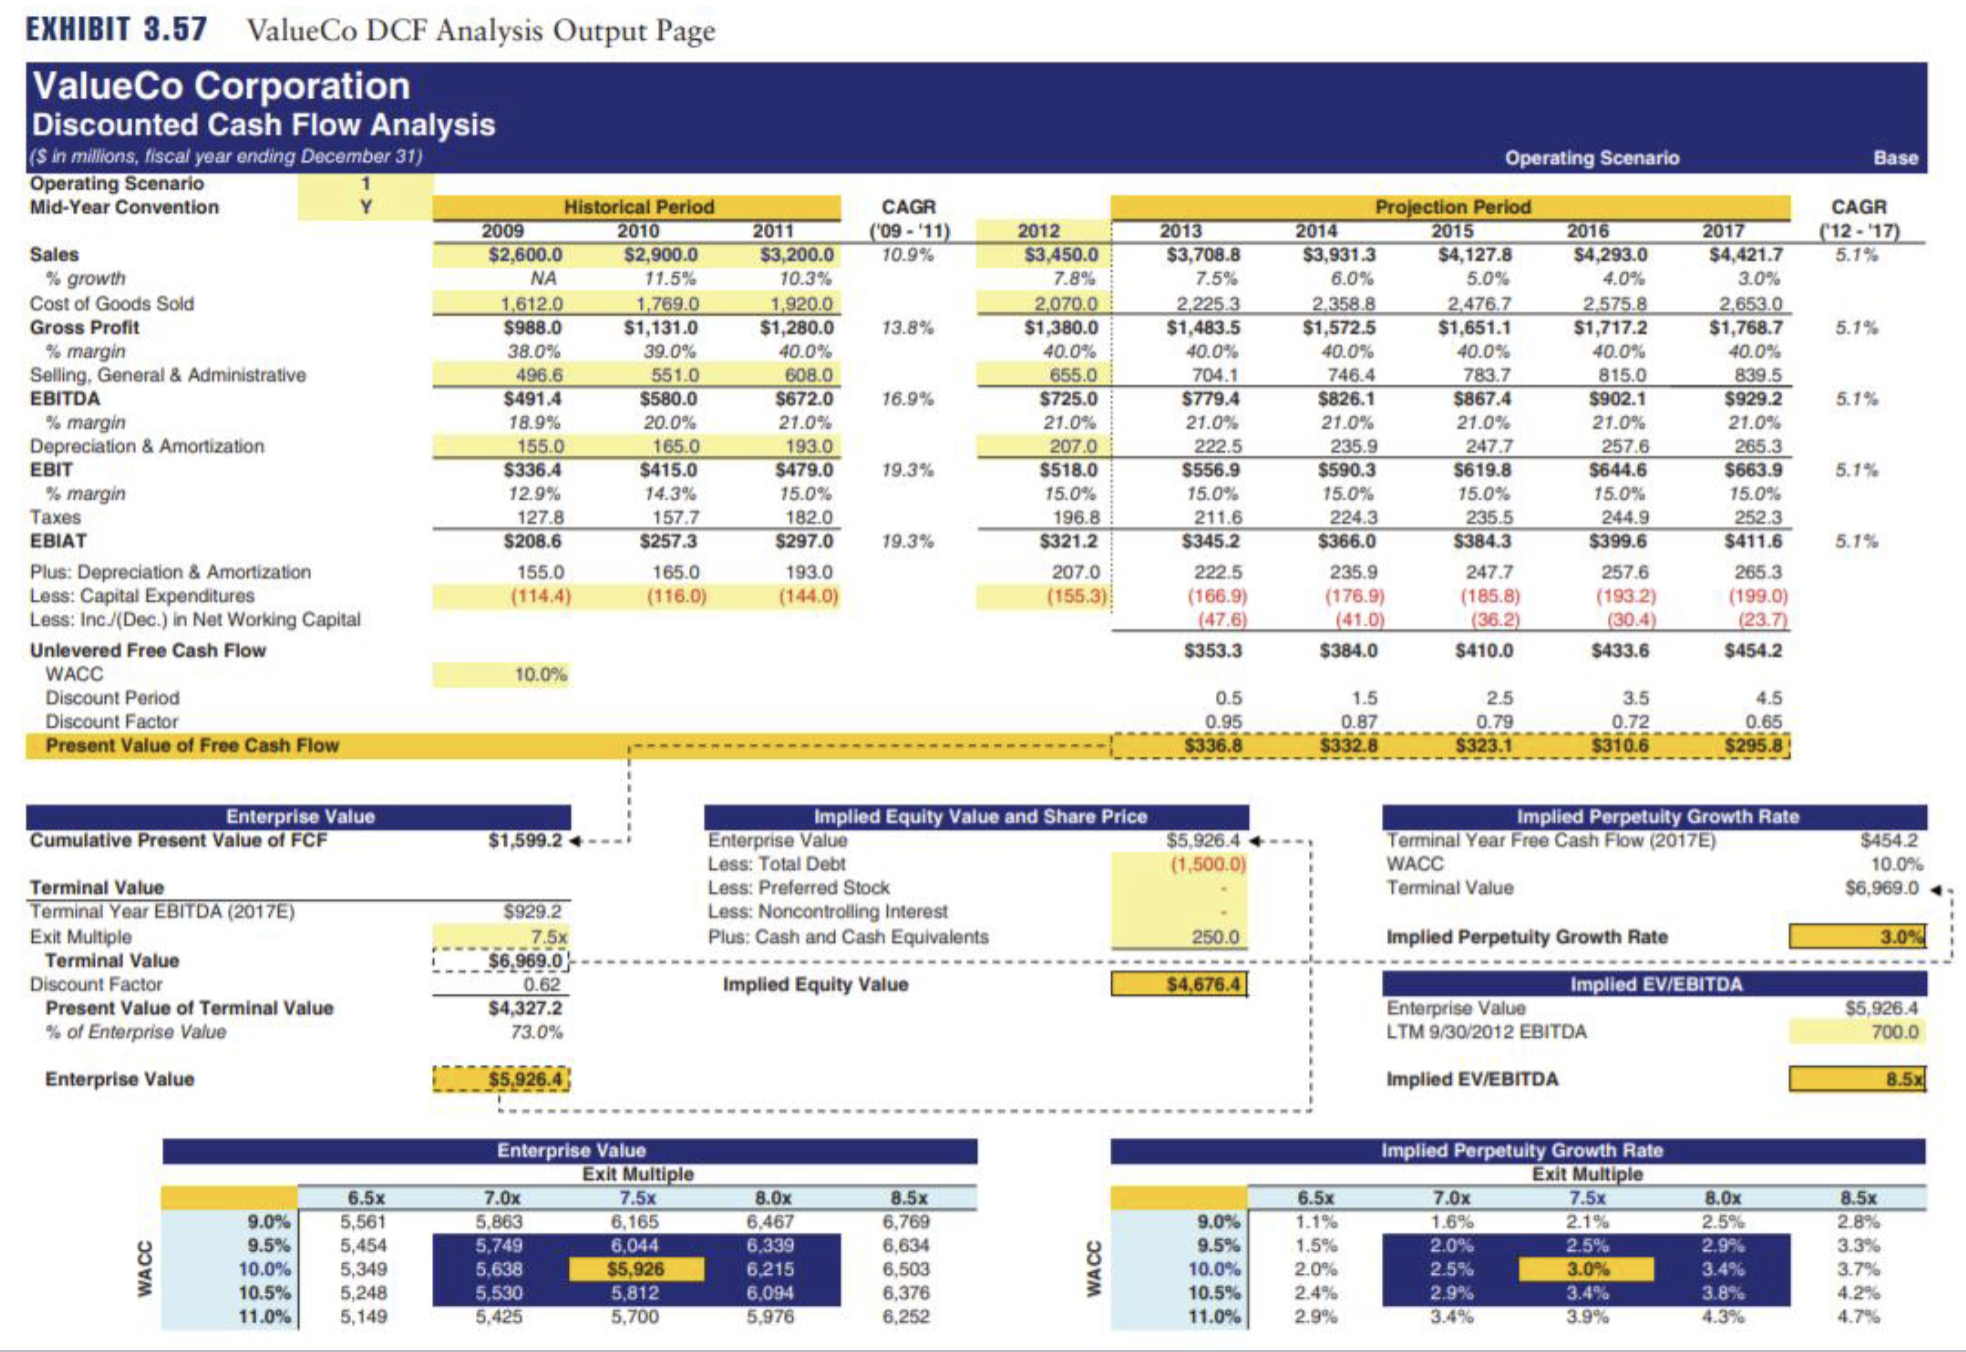
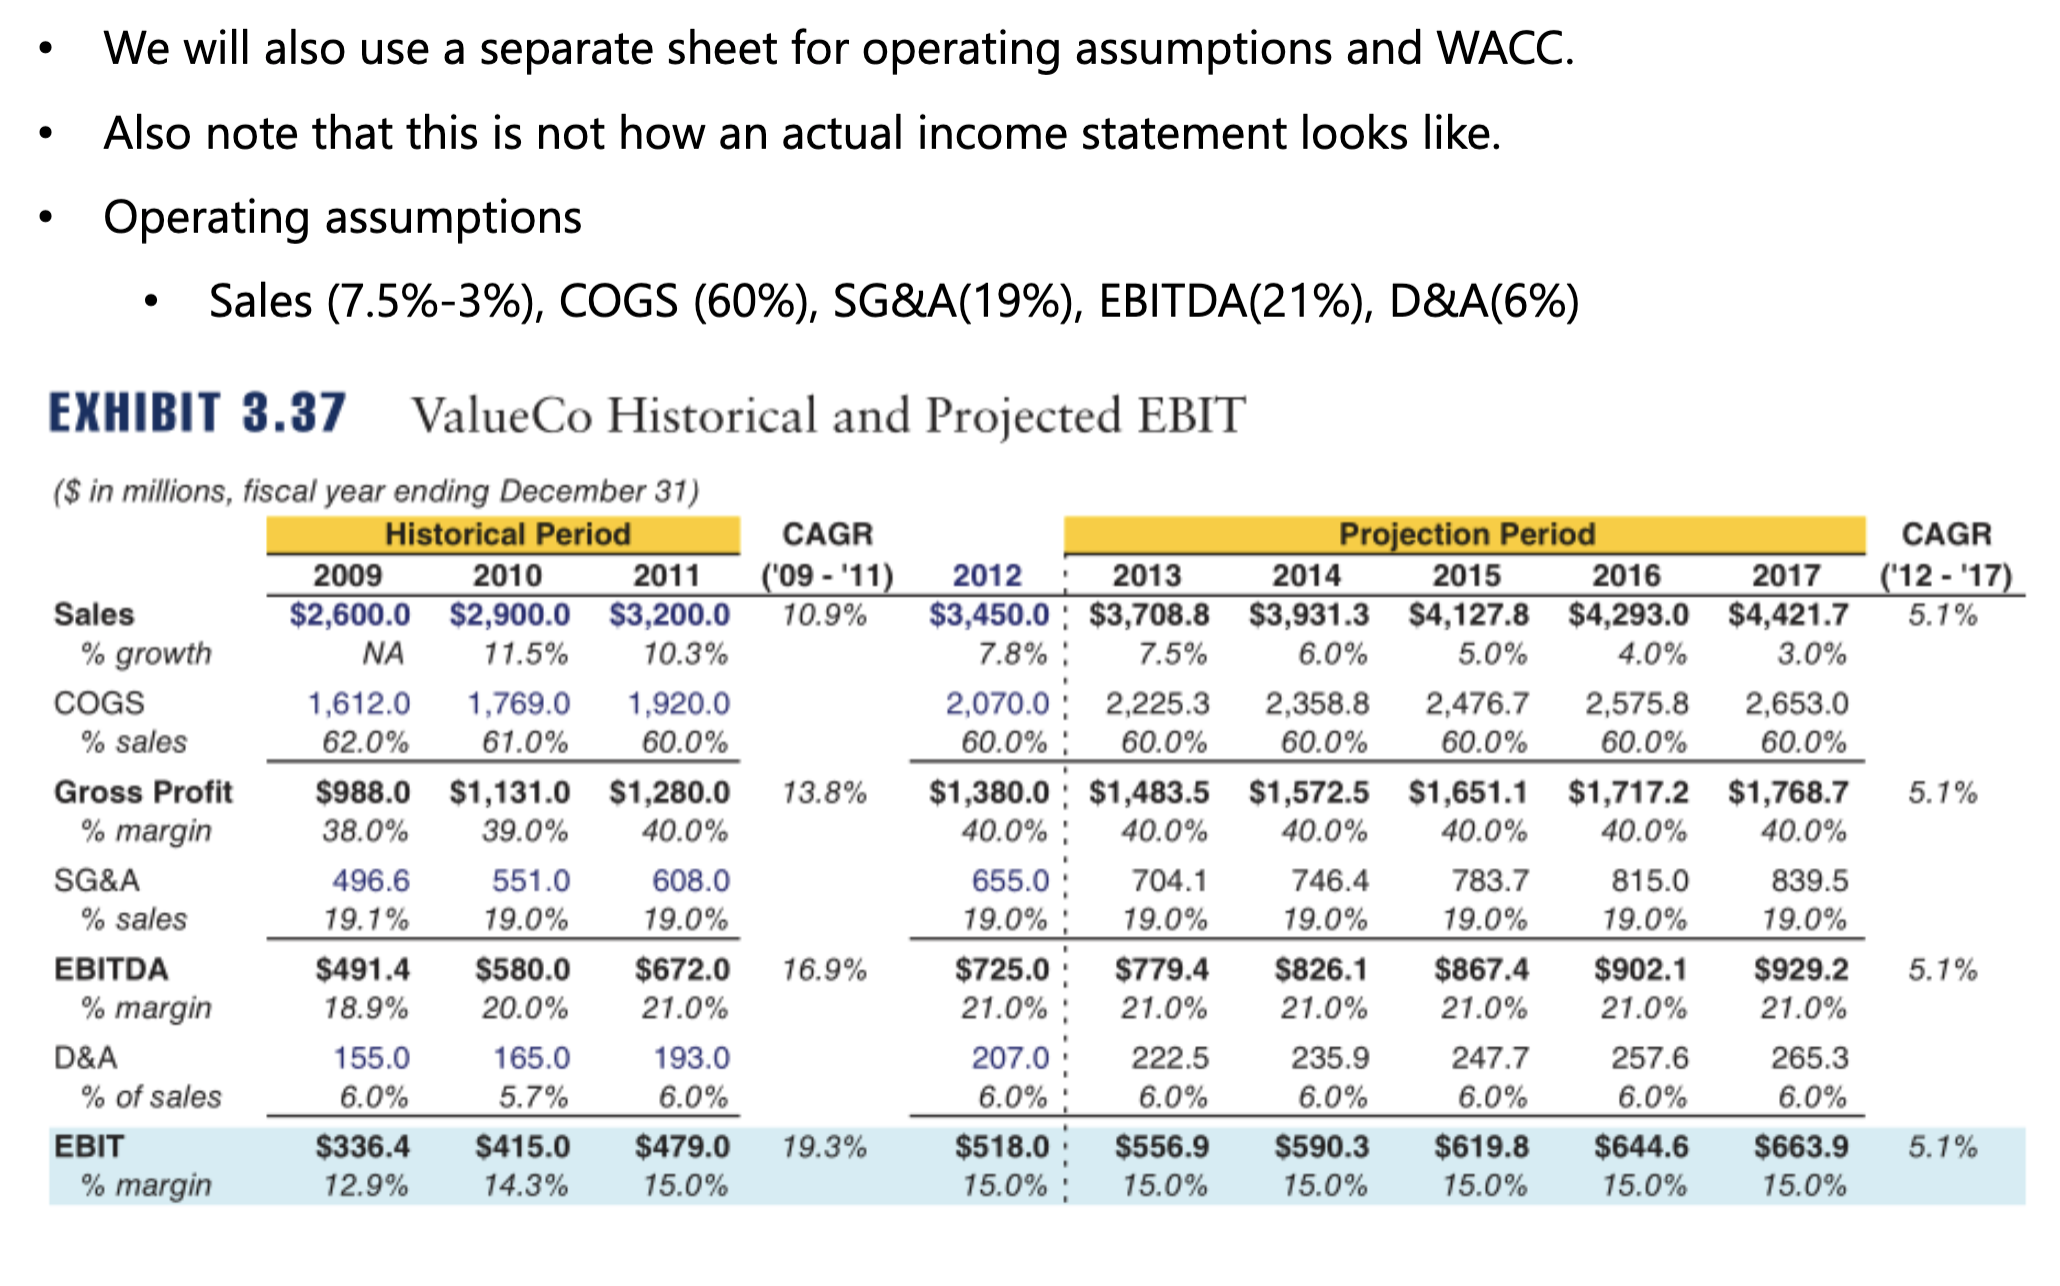
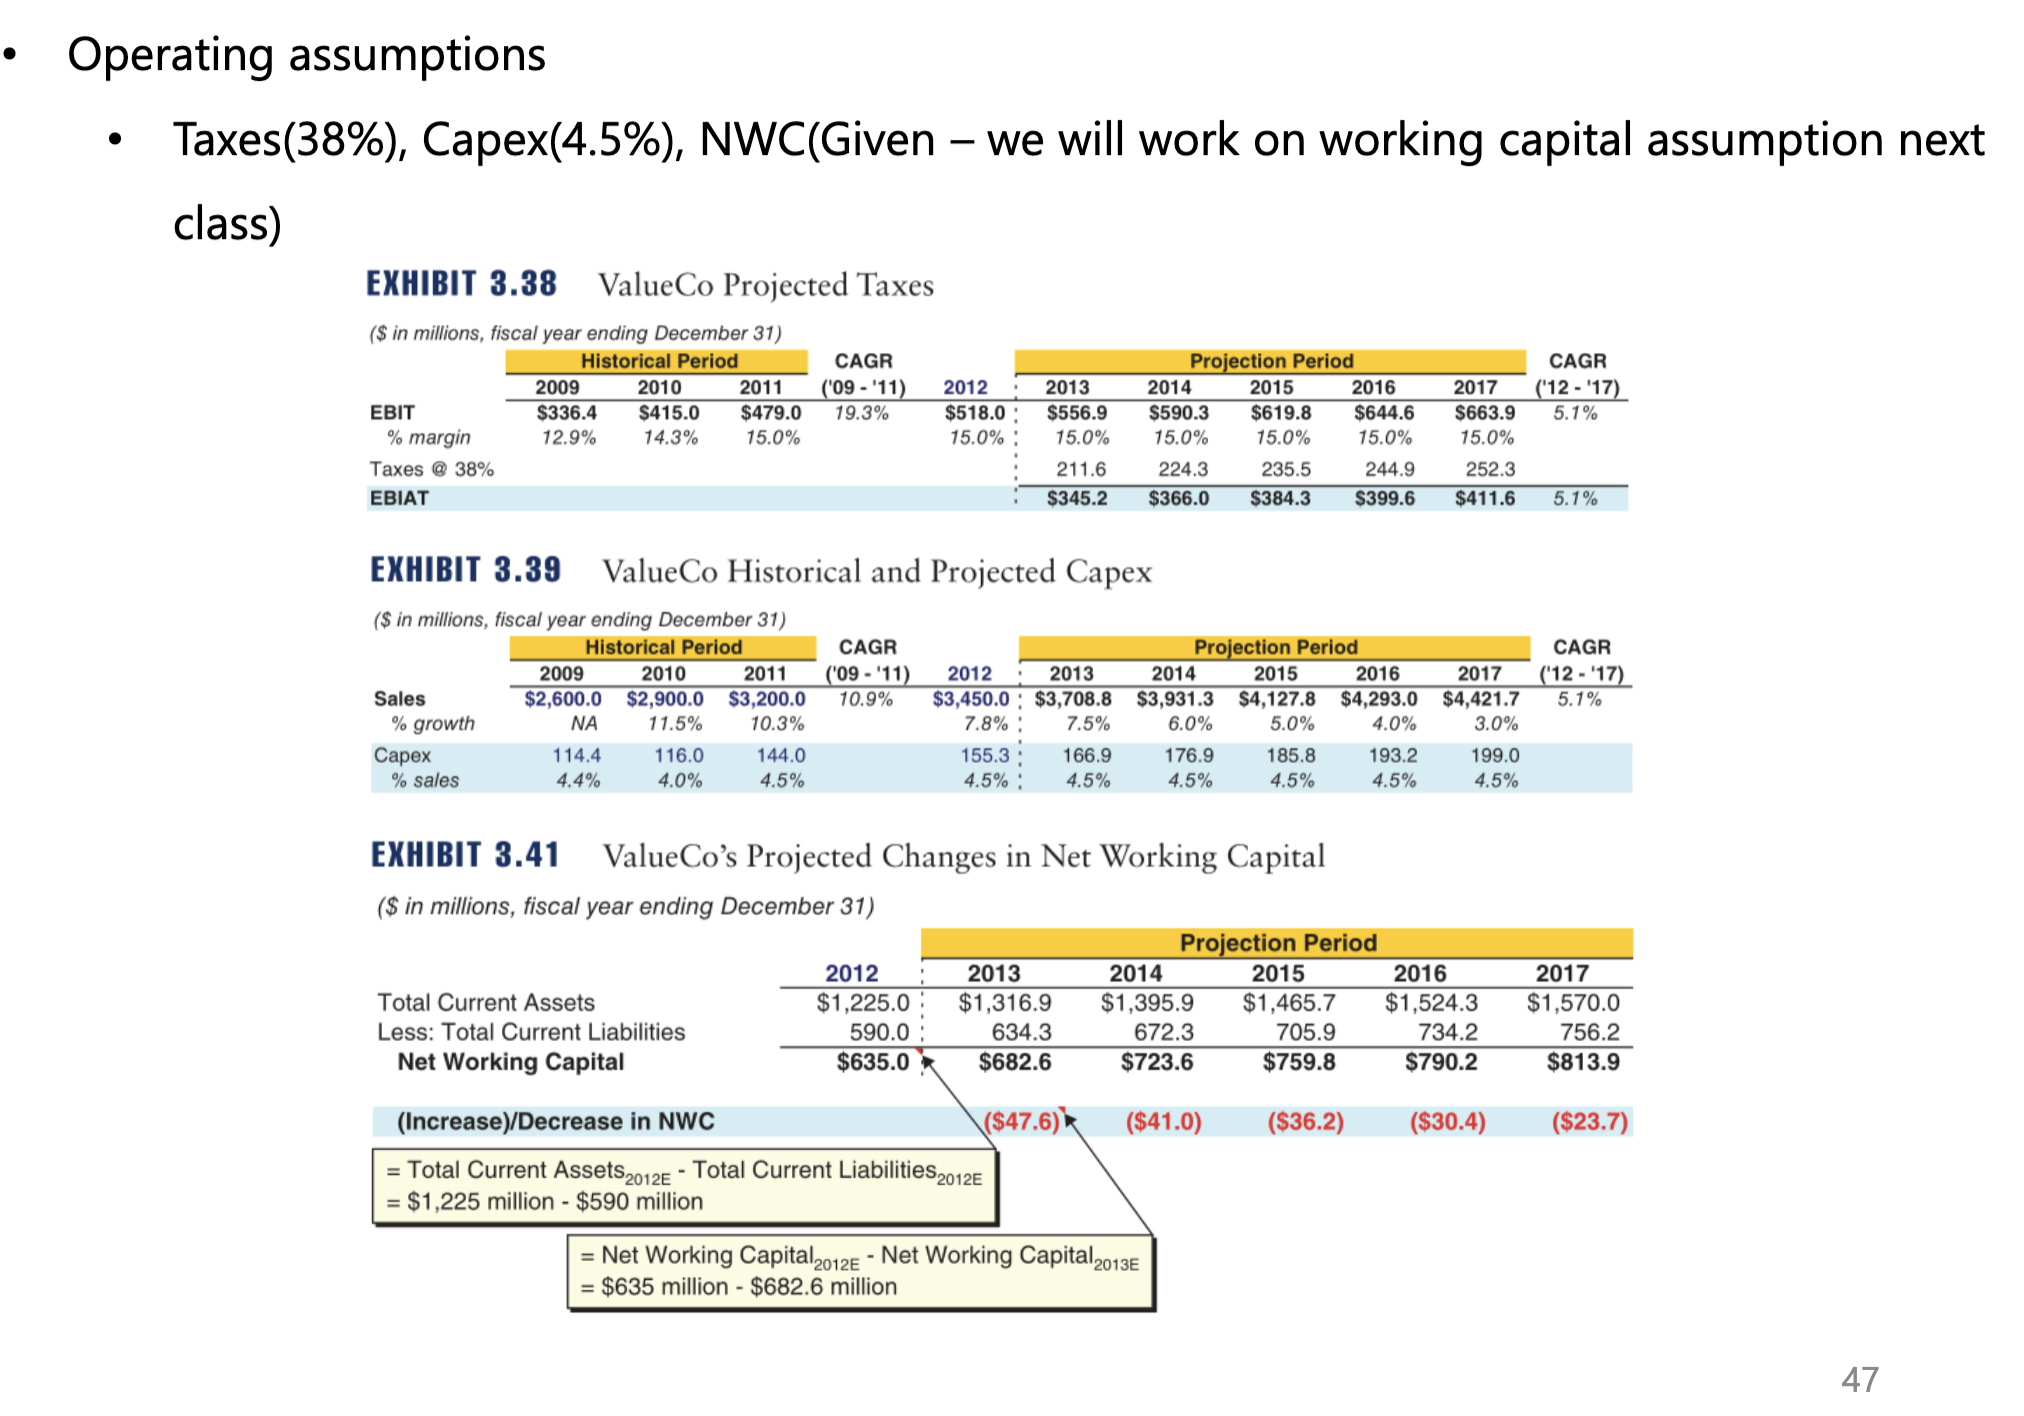
In the DCF analysis what is the enterprise value of ValueCo if the cost of goods sold
Fantastic news! We've Found the answer you've been seeking!
Question:
In the DCF analysis what is the enterprise value of ValueCo if the cost of goods sold is 55% and EBITDA margin is 26%
of sales in years 2013 - 2015, keeping all other assumptions identical?
Expert Answer:

Related Book For 
Fundamentals of Corporate Finance
ISBN: 978-0133400694
1st canadian edition
Authors: Jonathan Berk, Peter DeMarzo, Jarrad Harford, David A. Stangeland, Andras Marosi
Posted Date:
