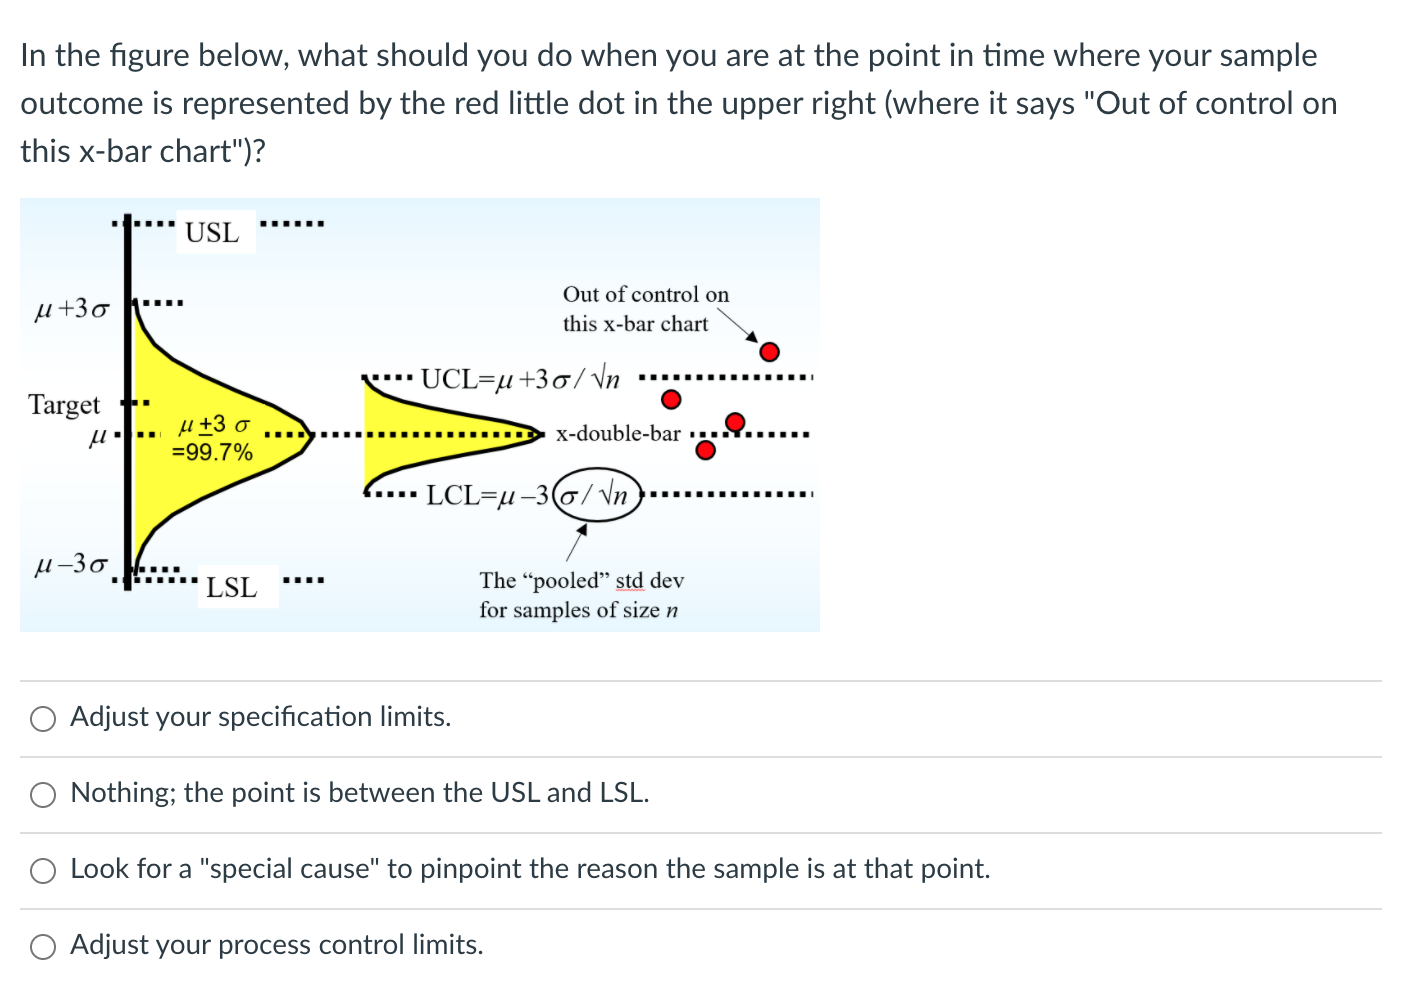
Question: In the figure below, what should you do when you are at the point in time where your sample outcome is represented by the red

In the figure below, what should you do when you

In the figure below, what should you do when you are at the point in time where your sample outcome is represented by the red little dot in the upper right (where it says "Out of control on this x-bar chart")? IIIII. USL III. u +30 Out of control on this x-bar chart V -- UCL=u +30 / Vn Target 1. u +30 =99.7% III. U- X-double-bar. LCL=u-36/Vn u30 LSL III. The pooled std dev for samples of size n Adjust your specification limits. O Nothing; the point is between the USL and LSL. Look for a "special cause" to pinpoint the reason the sample is at that point. O Adjust your process control limits

Step by Step Solution

There are 3 Steps involved in it

1 Expert Approved Answer
Step: 1 Unlock blur-text-image
Question Has Been Solved by an Expert!

Get step-by-step solutions from verified subject matter experts

Step: 2 Unlock
Step: 3 Unlock

Students Have Also Explored These Related General Management Questions!