

Question: in the first scatterplot i need to use logic functions to select only cars from the year 1976 or before. the second scatterplot needs to
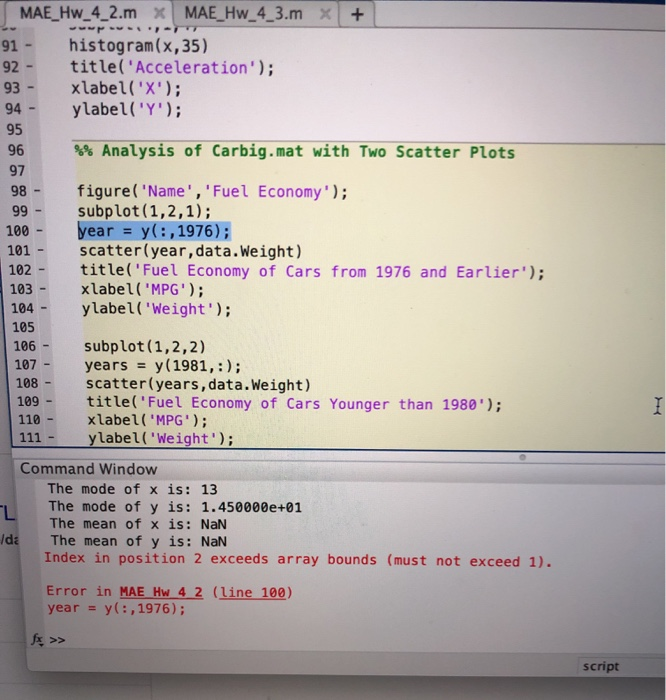 in the first scatterplot i need to use logic functions to select only cars from the year 1976 or before. the second scatterplot needs to select cars that are newer than 1980 (do t include 1980) this is the code i have so far please help!
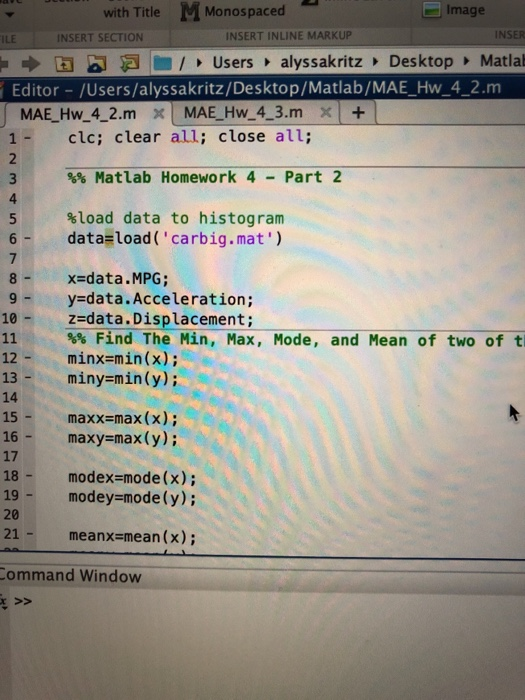
MAE_Hw_4_2. mx MAE_Hw_4_3. mx + 91 - histogram(x, 35) 92 - title('Acceleration'); xlabel('X'); 94 - ylabel('Y'); 93 - 95 96 %% Analysis of Carbig.mat with Two Scatter Plots 99 - 100 - 101 - figure( 'Name', 'Fuel Economy'); subplot(1,2,1); year = y(:,1976); scatter(year, data. Weight) title('Fuel Economy of Cars from 1976 and Earlier'); xlabel('MPG'); ylabel( 'weight'); 102 - 105 107 - 108 - 109 - 110 - subplot(1,2,2) years = y(1981,:); scatter(years, data. Weight) title('Fuel Economy of Cars Younger than 1980'); xlabel('MPG'); ylabel('Weight'); Command Window The mode of x is: 13 The mode of y is: 1.450000e+01 The mean of x is: NaN Ida The mean of y is: NaN Index in position 2 exceeds array bounds (must not exceed 1). Error in MAE Hw 4 2 (line 100) year = y(:, 1976); script with Title M Monospaced Image FILE INSERT SECTION INSERT INLINE MARKUP INSER b a / Users alyssakritz Desktop Matlab Editor - /Users/alyssakritz/Desktop/Matlab/MAE_HW_4_2.m MAE_Hw_4_2. mx MAE_Hw_4_3. mx + 1 - clc; clear all; close all; %% Matlab Homework 4 - Part 2 %load data to histogram data=load('carbig.mat') 8 - 10 - 11 x=data.MPG; y=data. Acceleration; z=data. Displacement; %% Find The Min, Max, Mode, and Mean of two of t minx=min(x); miny=min(y); 12 - maxx=max(x); maxy=max(y); 16 - 17 18 - 19 - modex=mode(x); modey=mode(y); 20 21 - meanx=mean(x); Command Window
Step by Step Solution
There are 3 Steps involved in it

Get step-by-step solutions from verified subject matter experts