

Question: In the following code, why do we use scaling? Bgplot() + geom_density (data-D, aes(x-scale(Height))) + geom_density(data-D, aes(x-scale(Weight)>) + geom_density(data=D, aes(x-scale(Age >>> To magnify non-overlapping parts
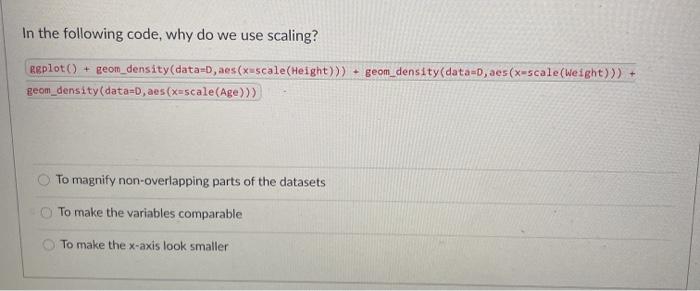
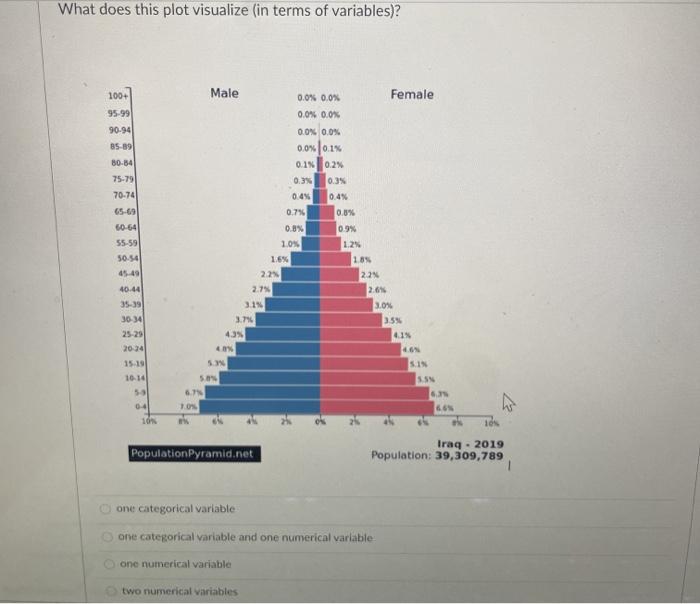
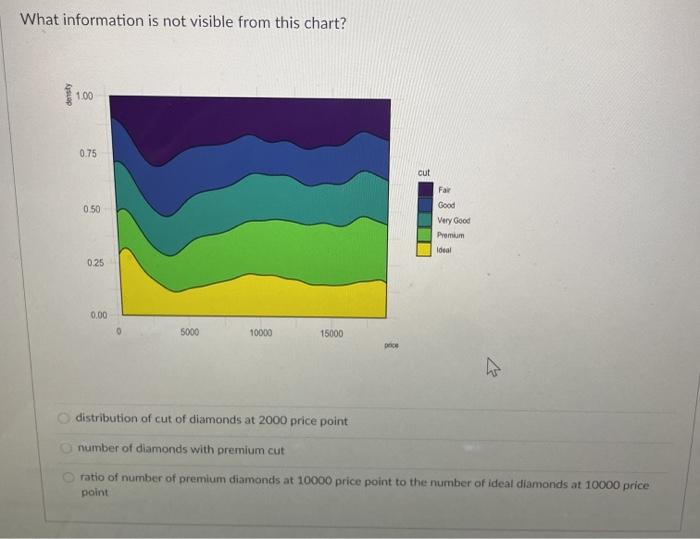
In the following code, why do we use scaling? Bgplot() + geom_density (data-D, aes(x-scale(Height))) + geom_density(data-D, aes(x-scale(Weight)>) + geom_density(data=D, aes(x-scale(Age >>> To magnify non-overlapping parts of the datasets To make the variables comparable To make the x-axis look smaller What does this plot visualize (in terms of variables)? 100+ 95-99 90-94 85-89 80-84 0.3 75-79 70-74 Male 0.0% 0.0% Female 0.0% 0.0% 0.0% 0.0% 0.0% 0.1% 0.1% 0.2% 0.3% 0.4% 0.4% 0.7% 0.0% 0.8% 0.9% 10% 12 1.6% 1.85 2.2% 2.2 2.75 2.6% 3.1% 3.0% 3.7% 3.5% 65-69 50-64 55-59 50-54 45-49 40.44 35-39 30-34 25-29 20-34 43 0.1% 4 10-14 50 SSN 6. 6 66 ON os 23 los Population Pyramid.net Iraq - 2019 Population: 39,309,789 one categorical variable one categorical variable and one numerical variable one numerical variable two numerical variables What information is not visible from this chart? density 1.00 0.75 cut 0.50 Far Good Very Good Premium local 0.25 0.00 5000 10000 15000 Doc distribution of cut of diamonds at 2000 price point number of diamonds with premium cut ratio of number of premium diamonds at 10000 price point to the number of ideal diamonds at 10000 price point
Step by Step Solution
There are 3 Steps involved in it

Get step-by-step solutions from verified subject matter experts