

Question: In the following Excel Solver sensitivity report, some values are missing as shown below. Determine the values of ONLY those missing items which are shaded
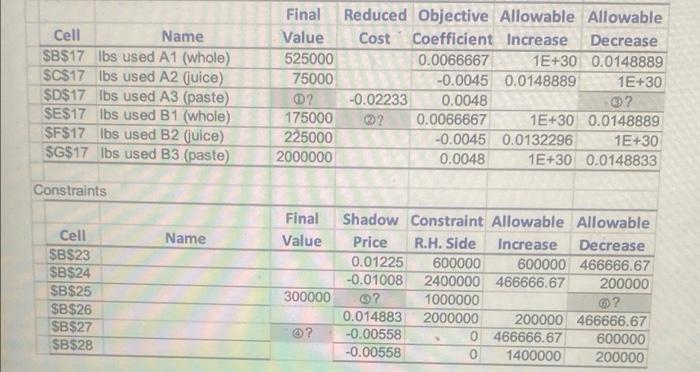
In the following Excel Solver sensitivity report, some values are missing as shown below.
Determine the values of ONLY those missing items which are shaded in grey AND labeled by a circled number and a question mark. Please fill in correct values in the space provided below:
1. 2. 3. 4. 5. 6.
Step by Step Solution
There are 3 Steps involved in it
1 Expert Approved Answer
Step: 1 Unlock

Question Has Been Solved by an Expert!
Get step-by-step solutions from verified subject matter experts
Step: 2 Unlock
Step: 3 Unlock