

Question: In the following Excel Solver sensitivity report, some values are missing as shown below. Determine the values of ONLY those missing items which are shaded
In the following Excel Solver sensitivity report, some values are missing as shown below.
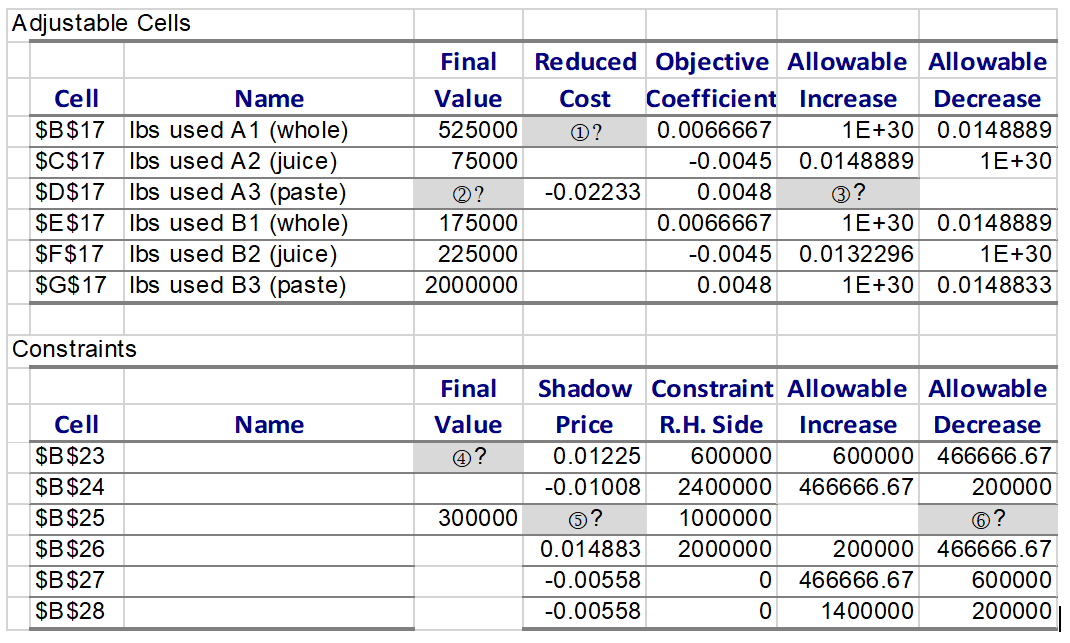
Determine the values of ONLY those missing items which are shaded in grey AND labeled by a circled number and a question mark. Please fill in correct values in the space provided below:
1.
2.
3.
4.
5.
6.
Adjustable Cells Cell Name $B$17 lbs used A1 (whole) $C$17 lbs used A2 (juice) $D$17 lbs used A3 (paste) $E$17 lbs used B1 (whole) $F$17 lbs used B2 (juice) $G$17 lbs used B3 (paste) Final Value 525000 75000 ? 175000 225000 2000000 Reduced Objective Allowable Allowable Cost Coefficient Increase Decrease ? 0.0066667 1E+30 0.0148889 -0.0045 0.0148889 1E+30 -0.02233 0.0048 3? 0.0066667 1E+30 0.0148889 -0.0045 0.0132296 1E+30 0.0048 1E+30 0.0148833 Constraints Name Final Value ? Cell $B$23 $B$24 $B$25 $B$26 $B$27 $B$28 Shadow Constraint Allowable Allowable P rice R.H. Side Increase Decrease 0.01225 600000 600000 466666.67 -0.01008 2400000 466666.67 200000 ? 1000000 0.014883 2000000 200000 466666.67 -0.00558 0466666.67 600000 -0.00558 O 1400000 200000 300000Step by Step Solution
There are 3 Steps involved in it
1 Expert Approved Answer
Step: 1 Unlock

Question Has Been Solved by an Expert!
Get step-by-step solutions from verified subject matter experts
Step: 2 Unlock
Step: 3 Unlock