

Question: In the following figure the error bars represent the standard error of the mean and the difference between groups has not been examined. 21 20
In the following figure the error bars represent the standard error of the mean and the difference between groups has not been examined.
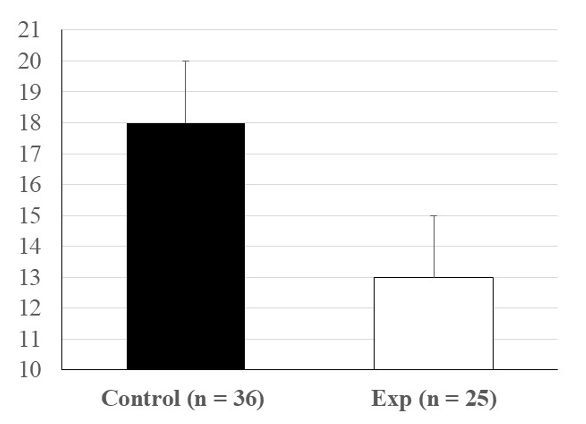
21 20 19 18 17 16 15 14 13 12 11 10 Control (n = 36) Exp (n = 25)
Step by Step Solution
There are 3 Steps involved in it
1 Expert Approved Answer
Step: 1 Unlock

Question Has Been Solved by an Expert!
Get step-by-step solutions from verified subject matter experts
Step: 2 Unlock
Step: 3 Unlock