

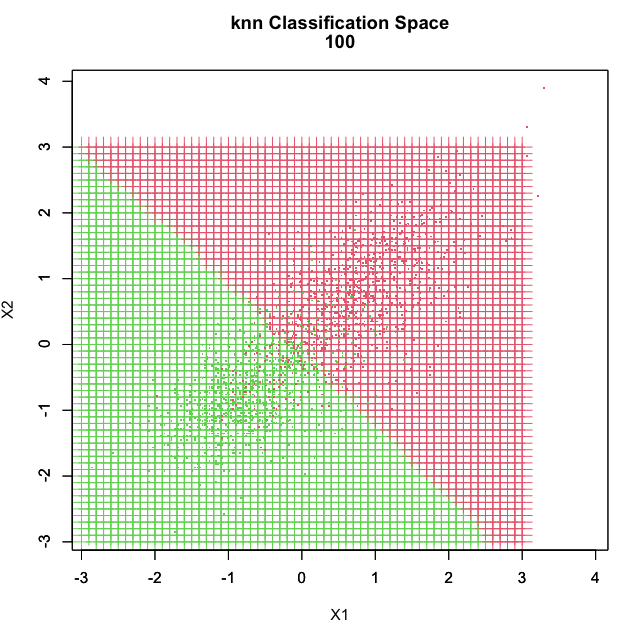
Question: in the following R program, the plot is not fully satisfactory. Find a way to shade the red region, say, rather than show it as
in the following R program, the plot is not fully satisfactory.
Find a way to shade the red region, say, rather than show it as red crosses.
Then there will be no need to show the green region - it will just be white.
Try making other improvements as they occur to you, such as including a legend or distinguishing data points which were misclassified!
NewProbeKnnBig =
function (TrialX, ProbeX, TrialY, k)
{
library(class)
ProbeYhat = knn(TrialX,ProbeX,TrialY,k)
MinX = min(TrialX)
MaxX = max(TrialX)
ProbeColor = c(cbind(ProbeYhat)+1)
plot(ProbeX[,1],ProbeX[,2],
main=c("knn Classification Space", k),
xlab="X1",ylab="X2",
cex=2, pch=3,
col=ProbeColor,
xlim=c(MinX,MaxX),
ylim=c(MinX,MaxX))
par(new=TRUE)
plot(TrialX[,1],TrialX[,2],
ann=FALSE,
pch=".",
col=c(cbind(TrialY)+17),
xlim=c(MinX,MaxX),
ylim=c(MinX,MaxX),
cex=2)
return()
}
\f
Step by Step Solution
There are 3 Steps involved in it

Get step-by-step solutions from verified subject matter experts