

Question: Q3 Descriptive Statistics 10 Points The two plots below were created using a data set containing information about movies released in 1995 and 2000. Note:
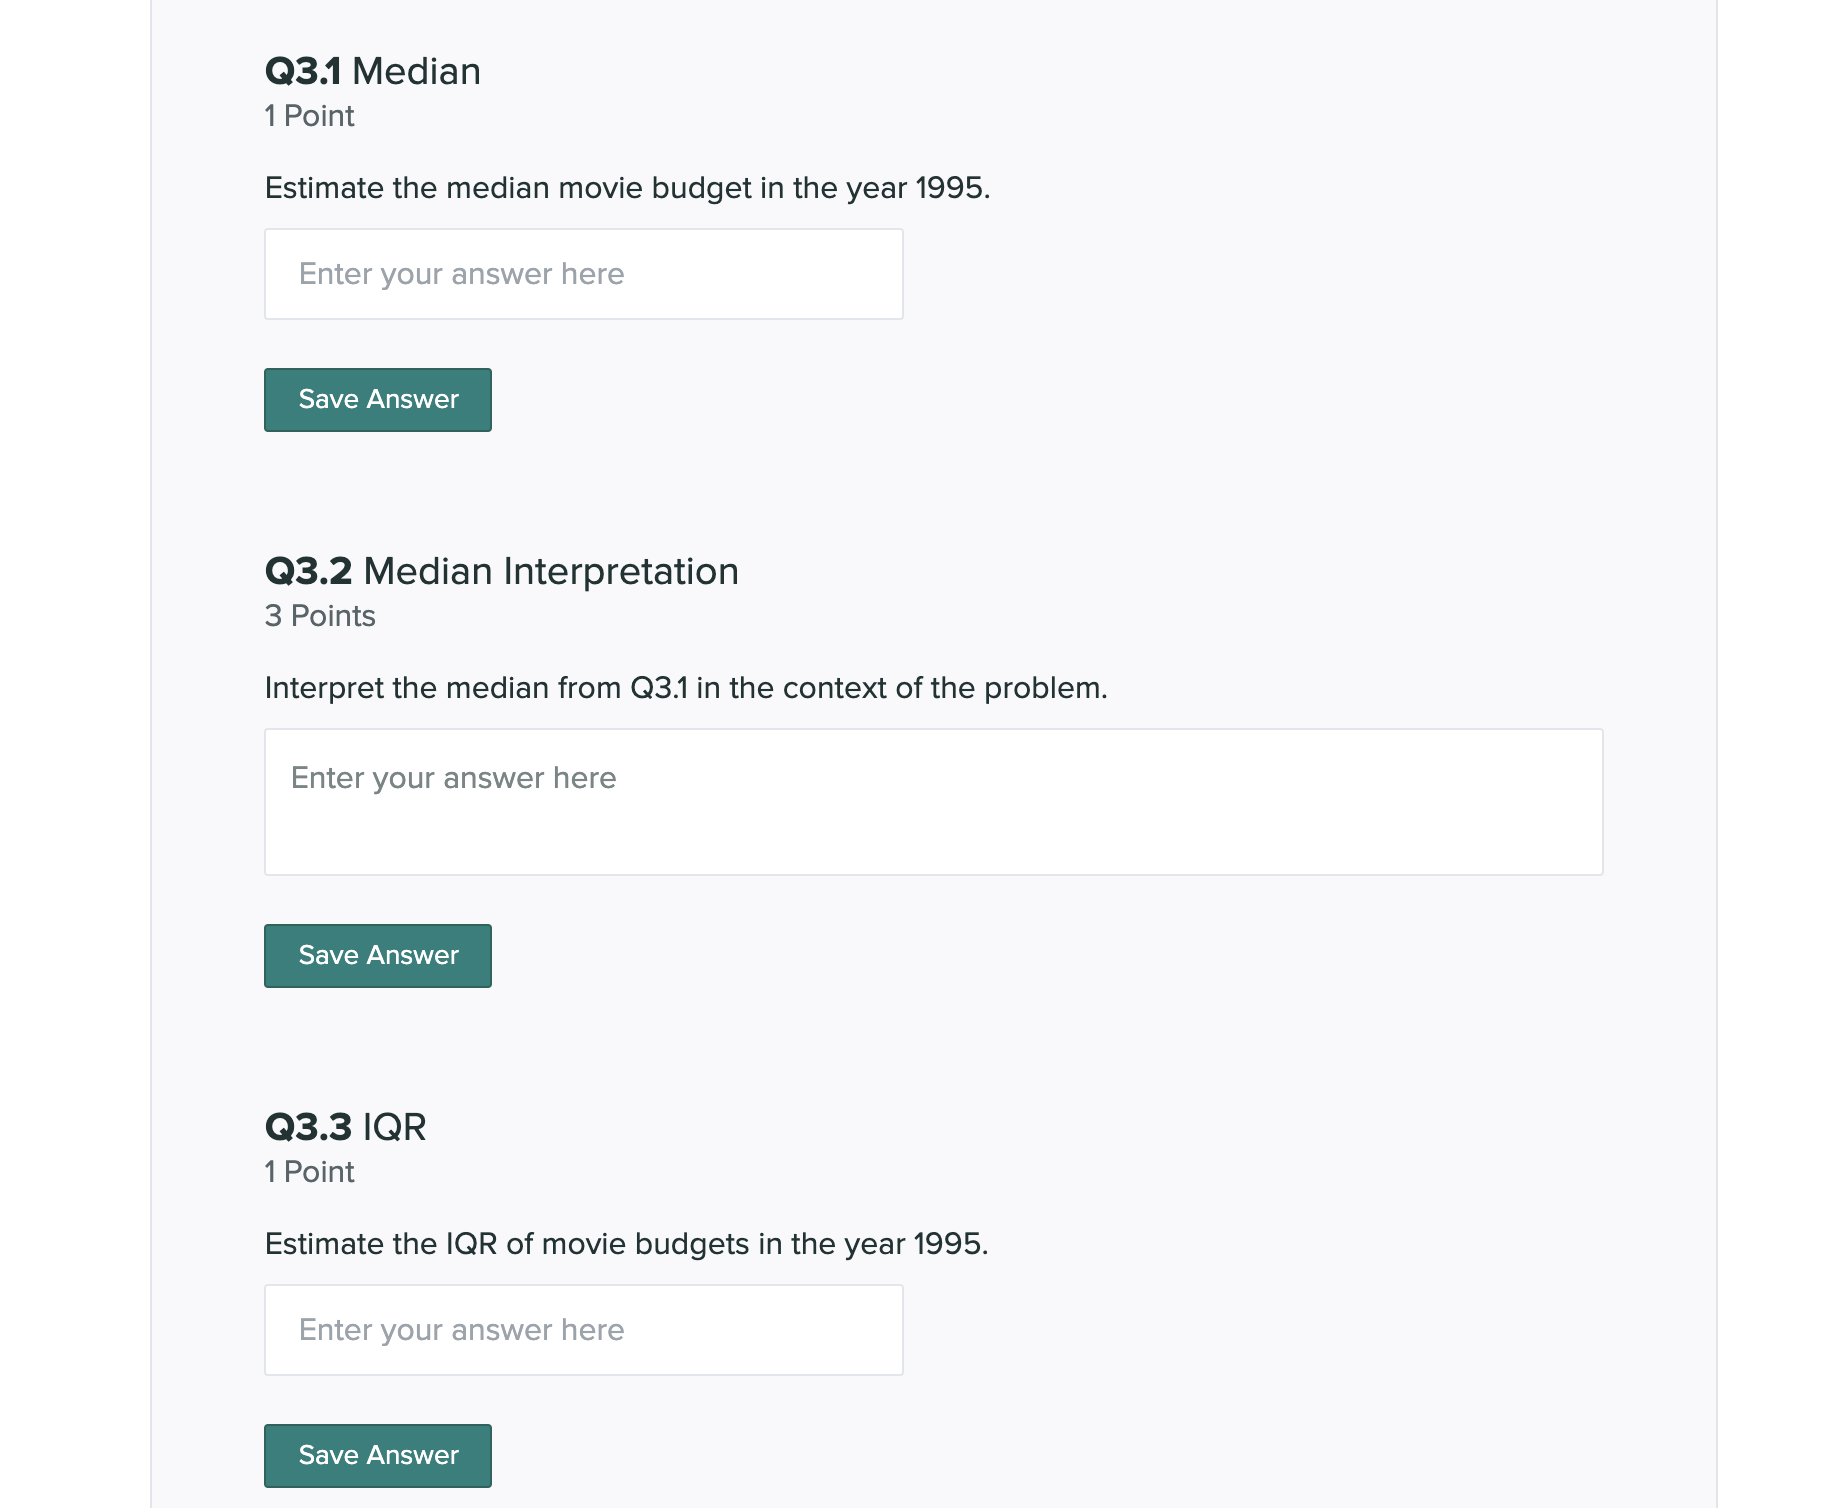
Q3 Descriptive Statistics 10 Points The two plots below were created using a data set containing information about movies released in 1995 and 2000. Note: M = million. Release Year Movies Released in 1995 and 2000 Movies Released in 1995 and 2000 01995 Release Year U 2000 El 180M 0 saw 160M 140M 400M 120M 3 m 3 100M g 300M a '32 a E 80M 200M 60M 40\" 100M 20M 0M 0M 0M 20M 40M 60M 80M 100M 120M 140M 160M 180M 1995 2000 Budge\": '9 03.1 Median 1 Point Estimate the median movie budget in the year 1995. Enter your answer here Save Answer 03.2 Median Interpretation 3 Points Interpret the median from 03.1 in the context of the problem. Enter your answer here Save Answer 03.3 IQR 1 Point Estimate the IQR of movie budgets in the year 1995. Enter your answer here Save Answer 03.4 IQR Interpretation 3 Points Interpret the IQR from 03.3 in the context of the problem. Enter your answer here Save Answer 03.5 Growth Trends 1 Point Did the relationship between budget and revenue change between 1995 and 2000? 0 Yes 0 No Save Answer 03.6 Decision 1 Point Which feature of the plot did you use to answer 03.5? 0 Comparing the yintercepts of the plot on the right. 0 Comparing the slopes of the plot on the right. 0 Comparing the centers of the plot on the left. 0 Comparing the variabilities of the plot on the left. Save
Step by Step Solution
There are 3 Steps involved in it

Get step-by-step solutions from verified subject matter experts