

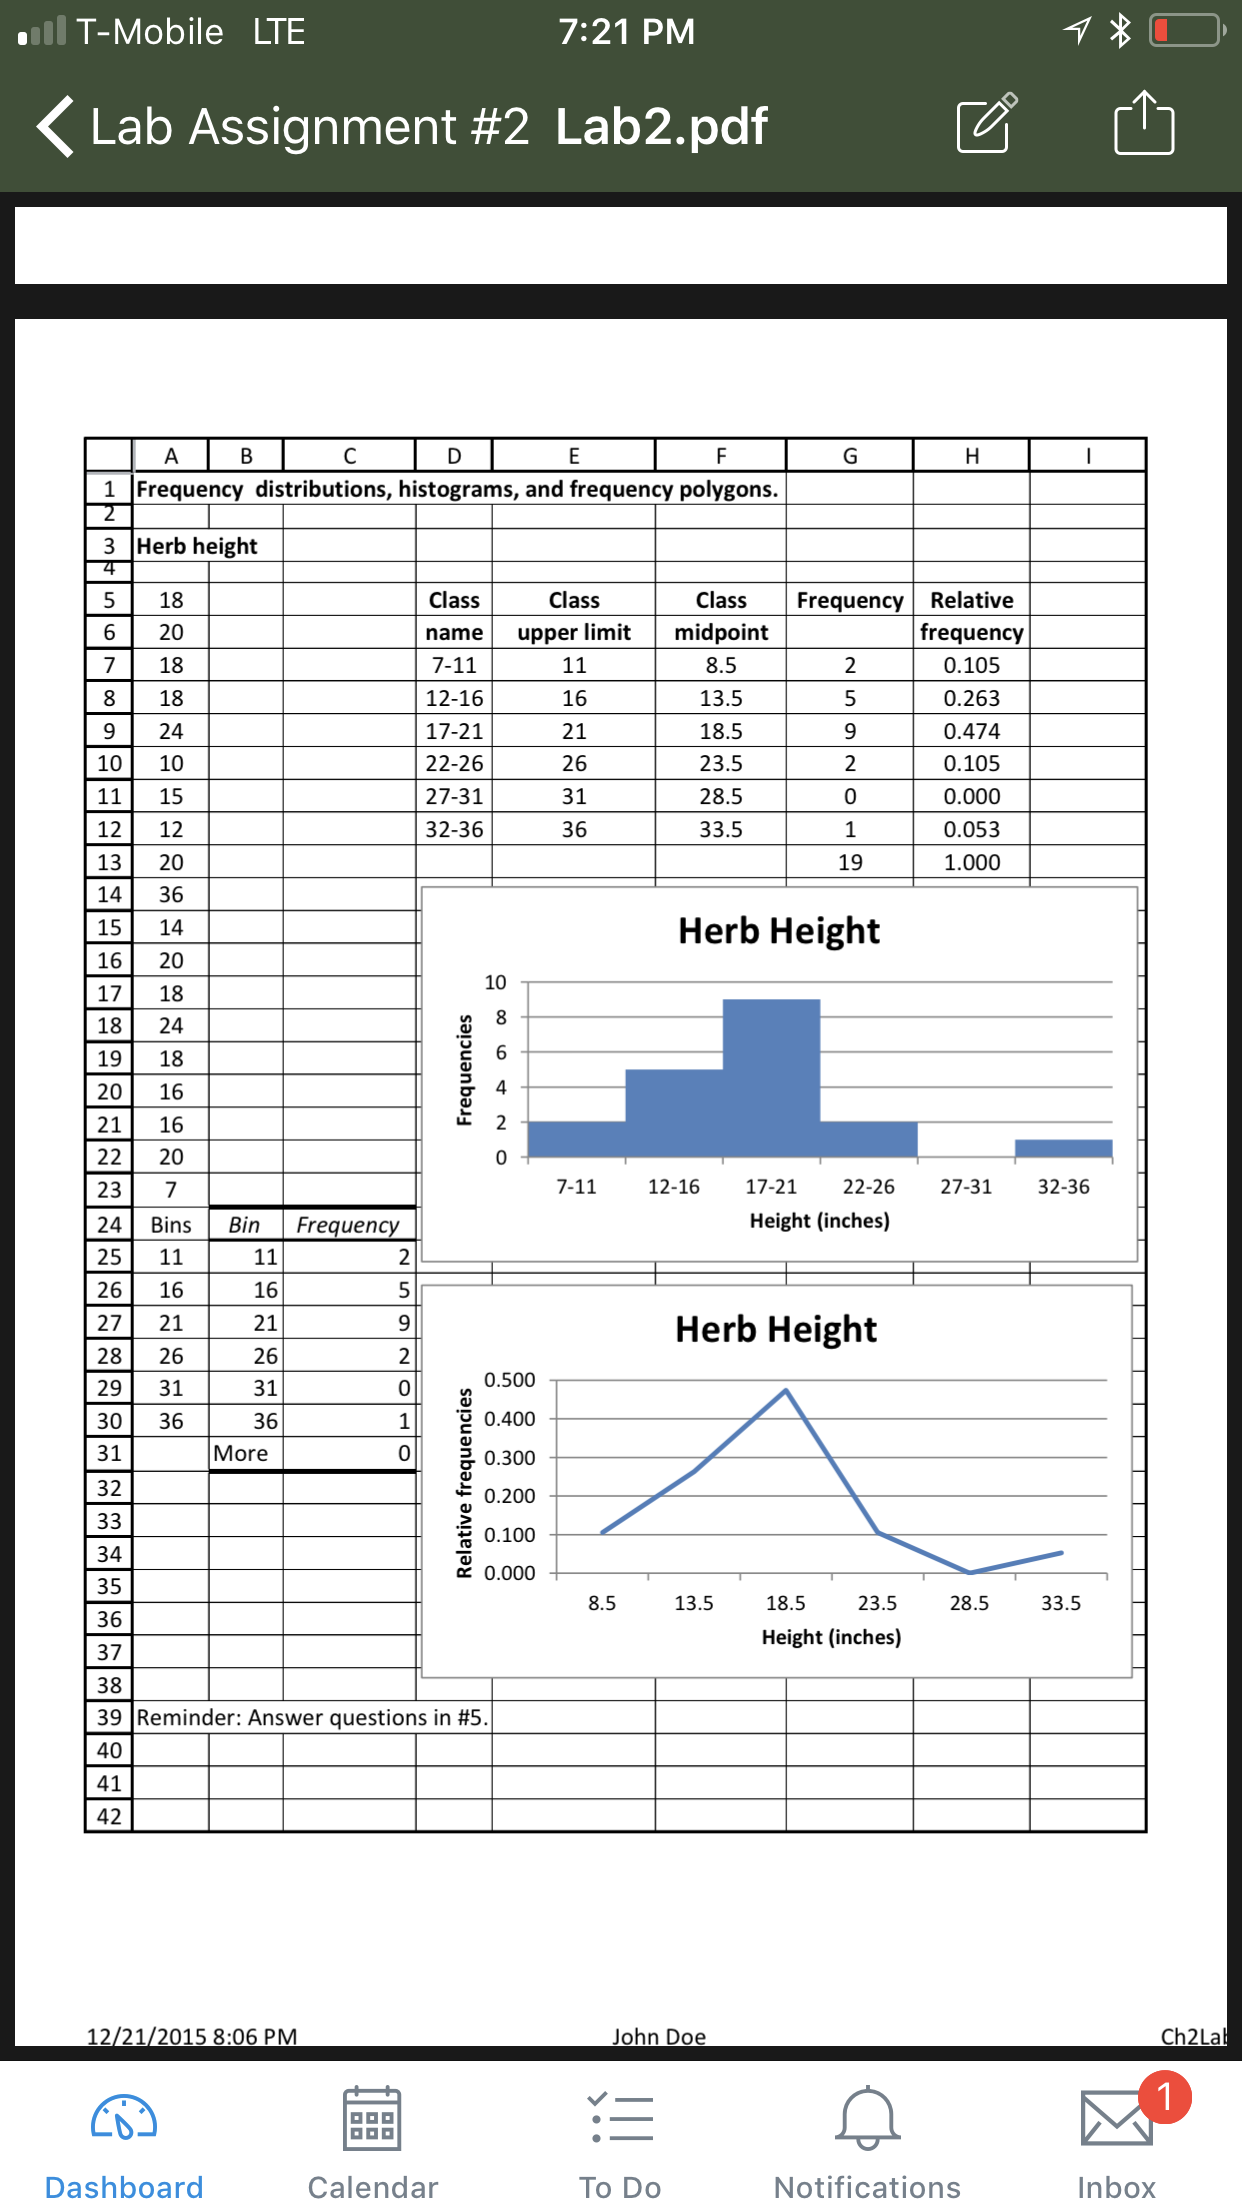
Question: In the frequency distribution table on your first page, what does Excel's Histogram function consider as the upper limit of the class labeled More? What
In the frequency distribution table on your first page, what does Excel's Histogram
function consider as the upper limit of the class labeled "More"? What does it
consider as the lower limit of the first class?
b. If you wanted to be sure that Histogram function did not include data that were less
than the lower limit of your first class, i.e. you did not want the first class to be open
ended, what change could you make in the limits you enter for the class limits?
c. Assume you are asked to make a presentation to an important client about the effect
of your company's SAT tutoring program. You have data from the 100 students
from your program and the 50 students from your competitor's program.
i. You want to show a chart that makes the point that your competitor's students did
not score as well as your firm in the range from 750 - 800? Would you use a
histogram, a relative frequency histogram, a frequency polygon, or a relative
frequency polygon? Why?
ii. If the same number of students from both programs had taken the test, would that
have changed your previous answer? Why?
OIL {_ Mobile LIVE
Step by Step Solution
There are 3 Steps involved in it

Get step-by-step solutions from verified subject matter experts