

Question: In the graph below, each unit on the horizontal axis is 2 . 1 0 1 0 - 3 m 3 and each unit on
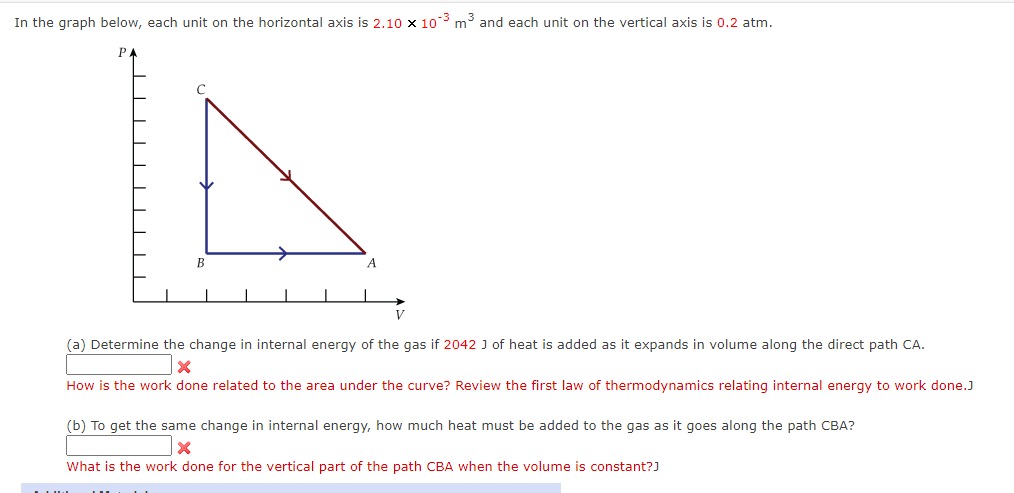
In the graph below, each unit on the horizontal axis is m and each unit on the vertical axis is atm.
a Determine the change in internal energy of the gas if J of heat is added as it expands in volume along the direct path CA
How is the work done related to the area under the curve? Review the first law of thermodynamics relating internal energy to work done.J
b To get the same change in internal energy, how much heat must be added to the gas as it goes along the path CBA? In the graph below, each unit on the horizontal axis is times mathrm~m and each unit on the vertical axis is atm.
a Determine the change in internal energy of the gas if J of heat is added as it expands in volume along the direct path CA
How is the work done related to the area under the curve? Review the first law of thermodynamics relating internal energy to work done.J
b To get the same change in internal energy, how much heat must be added to the gas as it goes along the path CBA?
What is the work done for the vertical part of the path CBA when the volume is constant?
Step by Step Solution
There are 3 Steps involved in it
1 Expert Approved Answer
Step: 1 Unlock

Question Has Been Solved by an Expert!
Get step-by-step solutions from verified subject matter experts
Step: 2 Unlock
Step: 3 Unlock