

Question: In the graph below, each unit on the horizontal axis is 1.20 10-3 m and each unit on the vertical axis is 40.0 kPa.
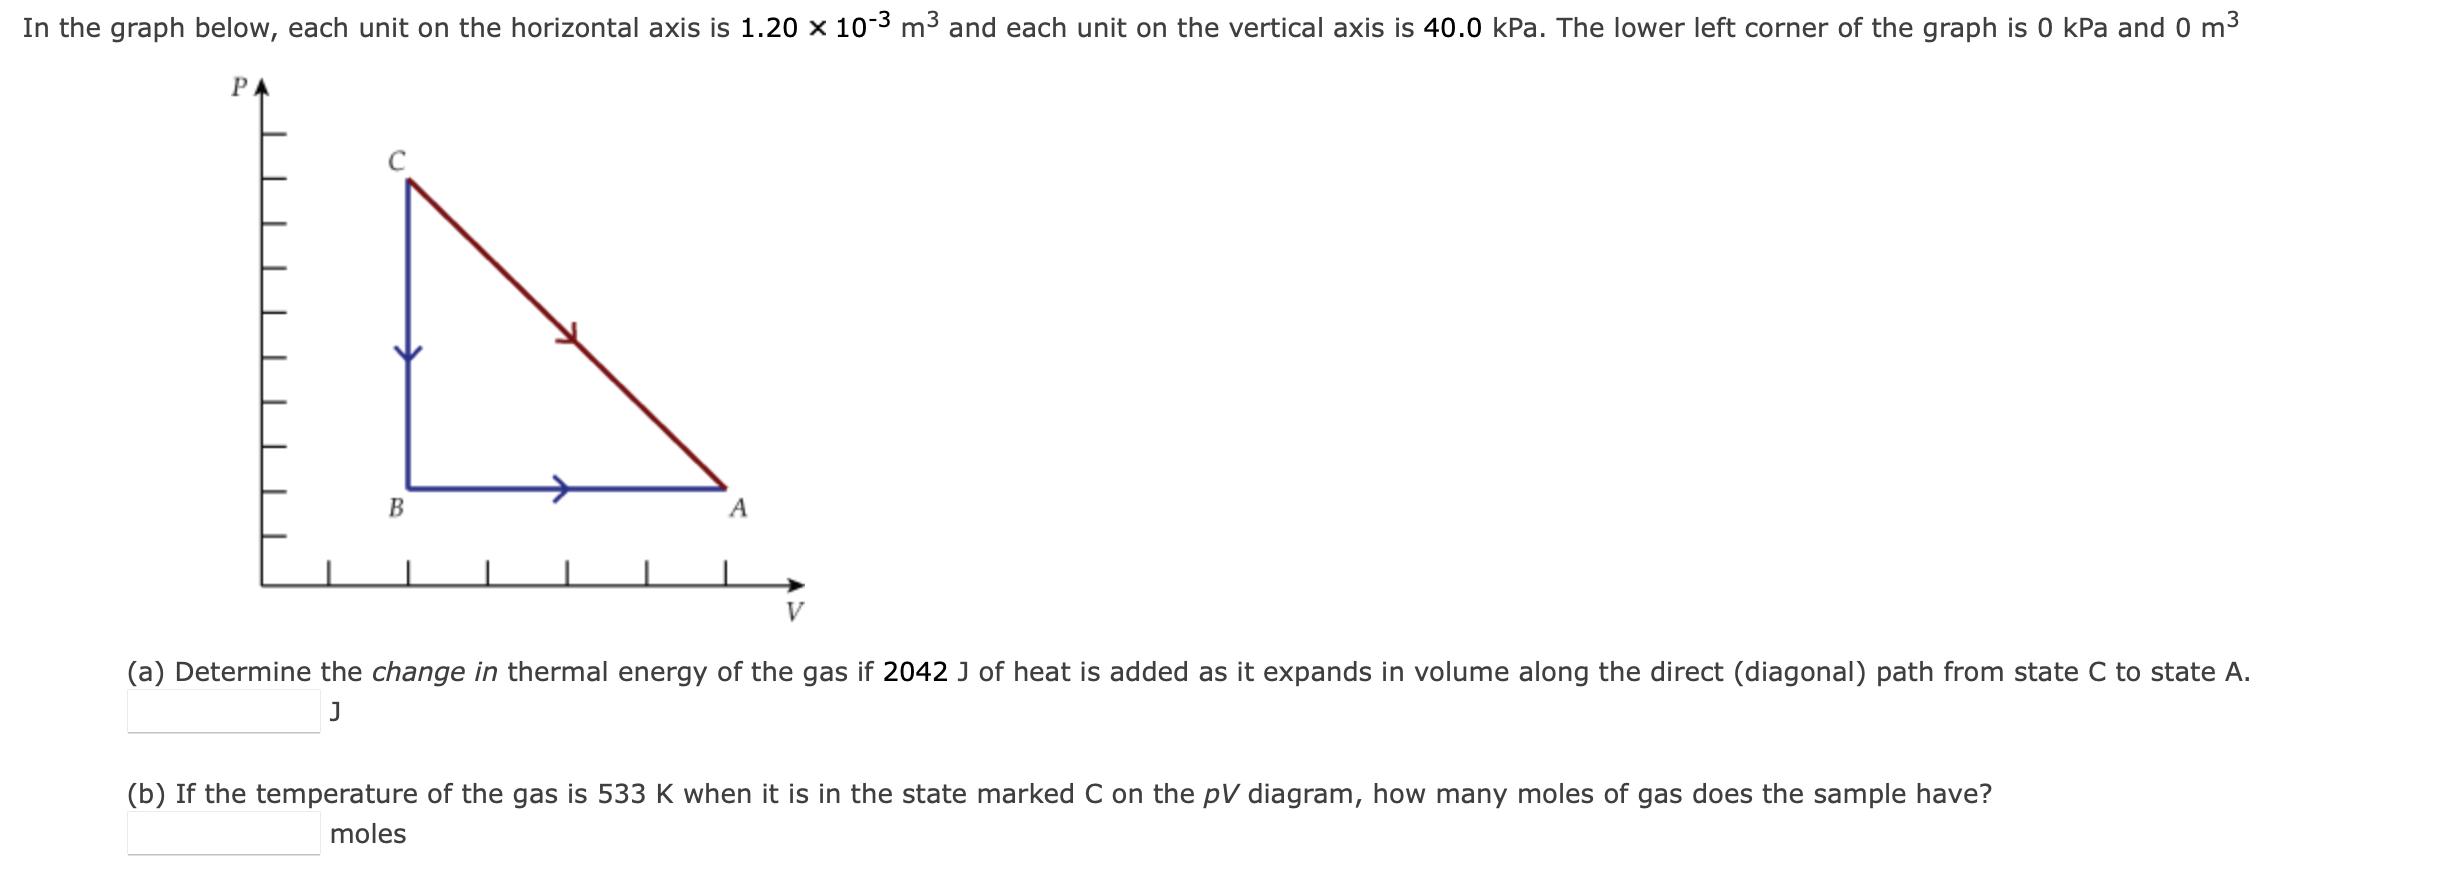
In the graph below, each unit on the horizontal axis is 1.20 10-3 m and each unit on the vertical axis is 40.0 kPa. The lower left corner of the graph is 0 kPa and 0 m PA B A V (a) Determine the change in thermal energy of the gas if 2042 J of heat is added as it expands in volume along the direct (diagonal) path from state C to state A. J (b) If the temperature of the gas is 533 K when it is in the state marked C on the pV diagram, how many moles of gas does the sample have? moles
Step by Step Solution
There are 3 Steps involved in it
1 Expert Approved Answer
Step: 1 Unlock

Question Has Been Solved by an Expert!
Get step-by-step solutions from verified subject matter experts
Step: 2 Unlock
Step: 3 Unlock