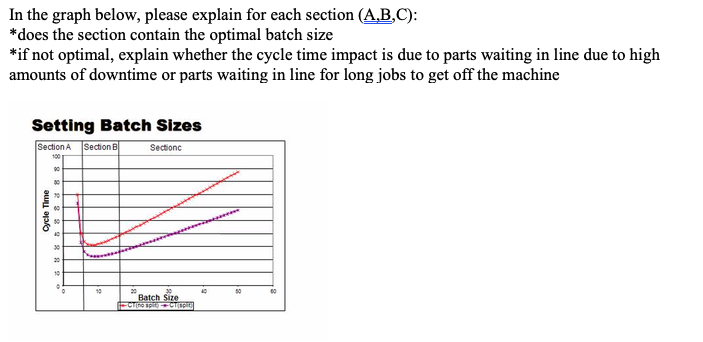
Question: In the graph below, please explain for each section (A,B,C): *does the section contain the optimal batch size *if not optimal, explain whether the cycle

In the graph below, please explain for each

In the graph below, please explain for each section (A,B,C): *does the section contain the optimal batch size *if not optimal, explain whether the cycle time impact is due to parts waiting in line due to high amounts of downtime or parts waiting in line for long jobs to get off the machine Setting Batch Sizes Section A Section Sectionc Cycle Time 40 Batch Size Can

Step by Step Solution

There are 3 Steps involved in it

1 Expert Approved Answer
Step: 1 Unlock blur-text-image
Question Has Been Solved by an Expert!

Get step-by-step solutions from verified subject matter experts

Step: 2 Unlock
Step: 3 Unlock

Students Have Also Explored These Related General Management Questions!