

Question: In the Initial Analysis worksheet, using the Excel table just copied there: a. Create a Pivot Table using all 2016 and 2017 data. b. Locate
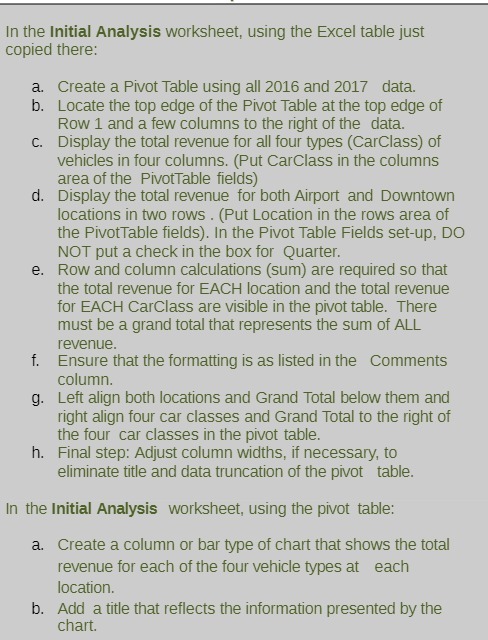
In the Initial Analysis worksheet, using the Excel table just copied there: a. Create a Pivot Table using all 2016 and 2017 data. b. Locate the top edge of the Pivot Table at the top edge of Row 1 and a few columns to the right of the data. C. Display the total revenue for all four types (Carclass) of vehicles in four columns. (Put CarClass in the columns area of the PivotTable fields) d. Display the total revenue for both Airport and Downtown locations in two rows . (Put Location in the rows area of the PivotTable fields). In the Pivot Table Fields set-up, DO NOT put a check in the box for Quarter. e. Row and column calculations (sum) are required so that the total revenue for EACH location and the total revenue for EACH CarClass are visible in the pivot table. There must be a grand total that represents the sum of ALL revenue. f. Ensure that the formatting is as listed in the Comments column. g. Left align both locations and Grand Total below them and right align four car classes and Grand Total to the right of the four car classes in the pivot table. h. Final step: Adjust column widths, if necessary, to eliminate title and data truncation of the pivot table. In the Initial Analysis worksheet, using the pivot table: a. Create a column or bar type of chart that shows the total revenue for each of the four vehicle types at each location. b. Add a title that reflects the information presented by the chart
Step by Step Solution
There are 3 Steps involved in it

Get step-by-step solutions from verified subject matter experts