

Question: In the network shown below represent a bridge project network. Compute and tabulate activity times and identify critical path and generate project from Es bar
In the network shown below represent a bridge project network. Compute and tabulate activity times and identify critical path and generate project from Es bar chart assuming daily cost $100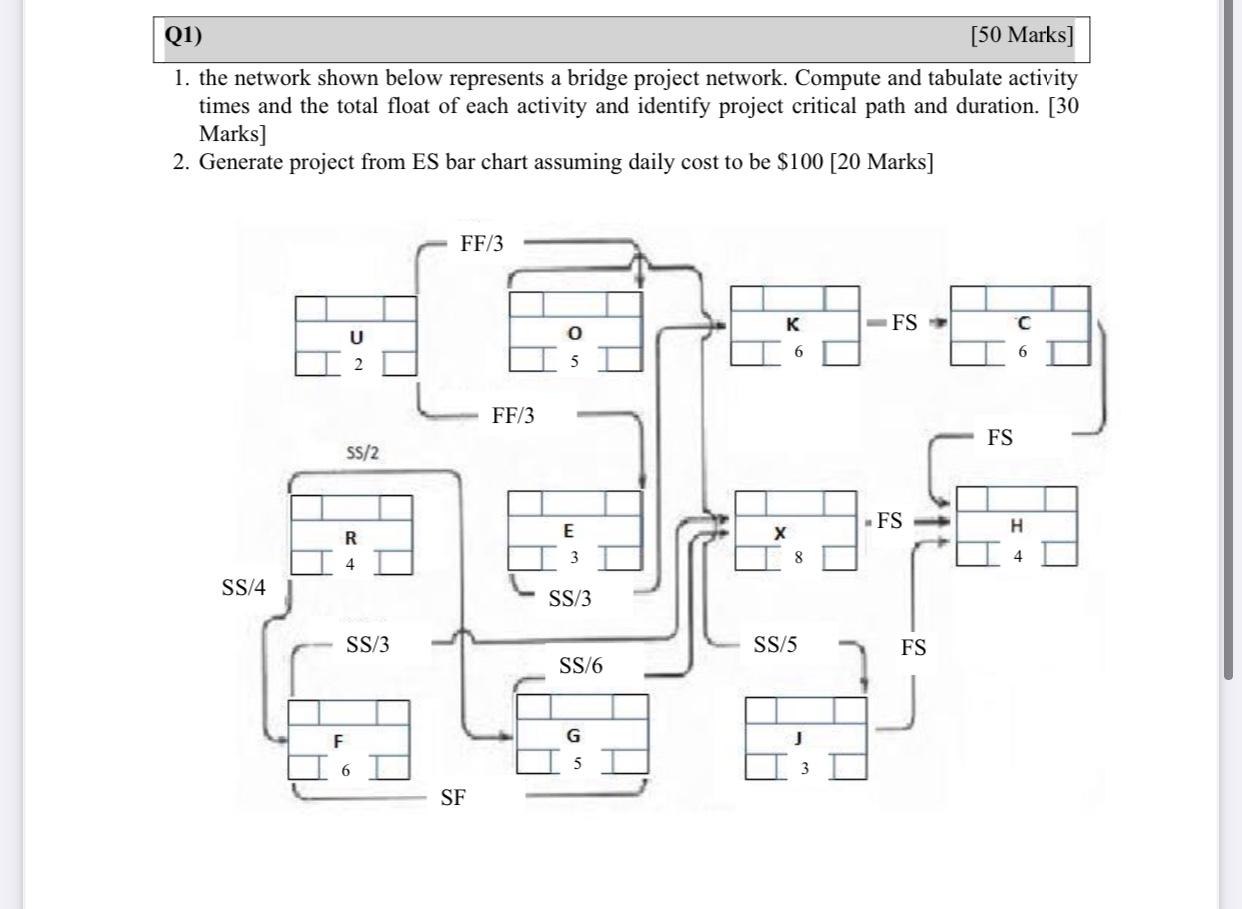
1. the network shown below represents a bridge project network. Compute and tabulate activity times and the total float of each activity and identify project critical path and duration. [ 30 Marks] 2. Generate project from ES bar chart assuming daily cost to be $100 [20 Marks]
Step by Step Solution
There are 3 Steps involved in it
1 Expert Approved Answer
Step: 1 Unlock

Question Has Been Solved by an Expert!
Get step-by-step solutions from verified subject matter experts
Step: 2 Unlock
Step: 3 Unlock