

Question: In the plot below of error vs. sample size, there are two lines (A and B). Label which of the relationships depicts your Jutematic
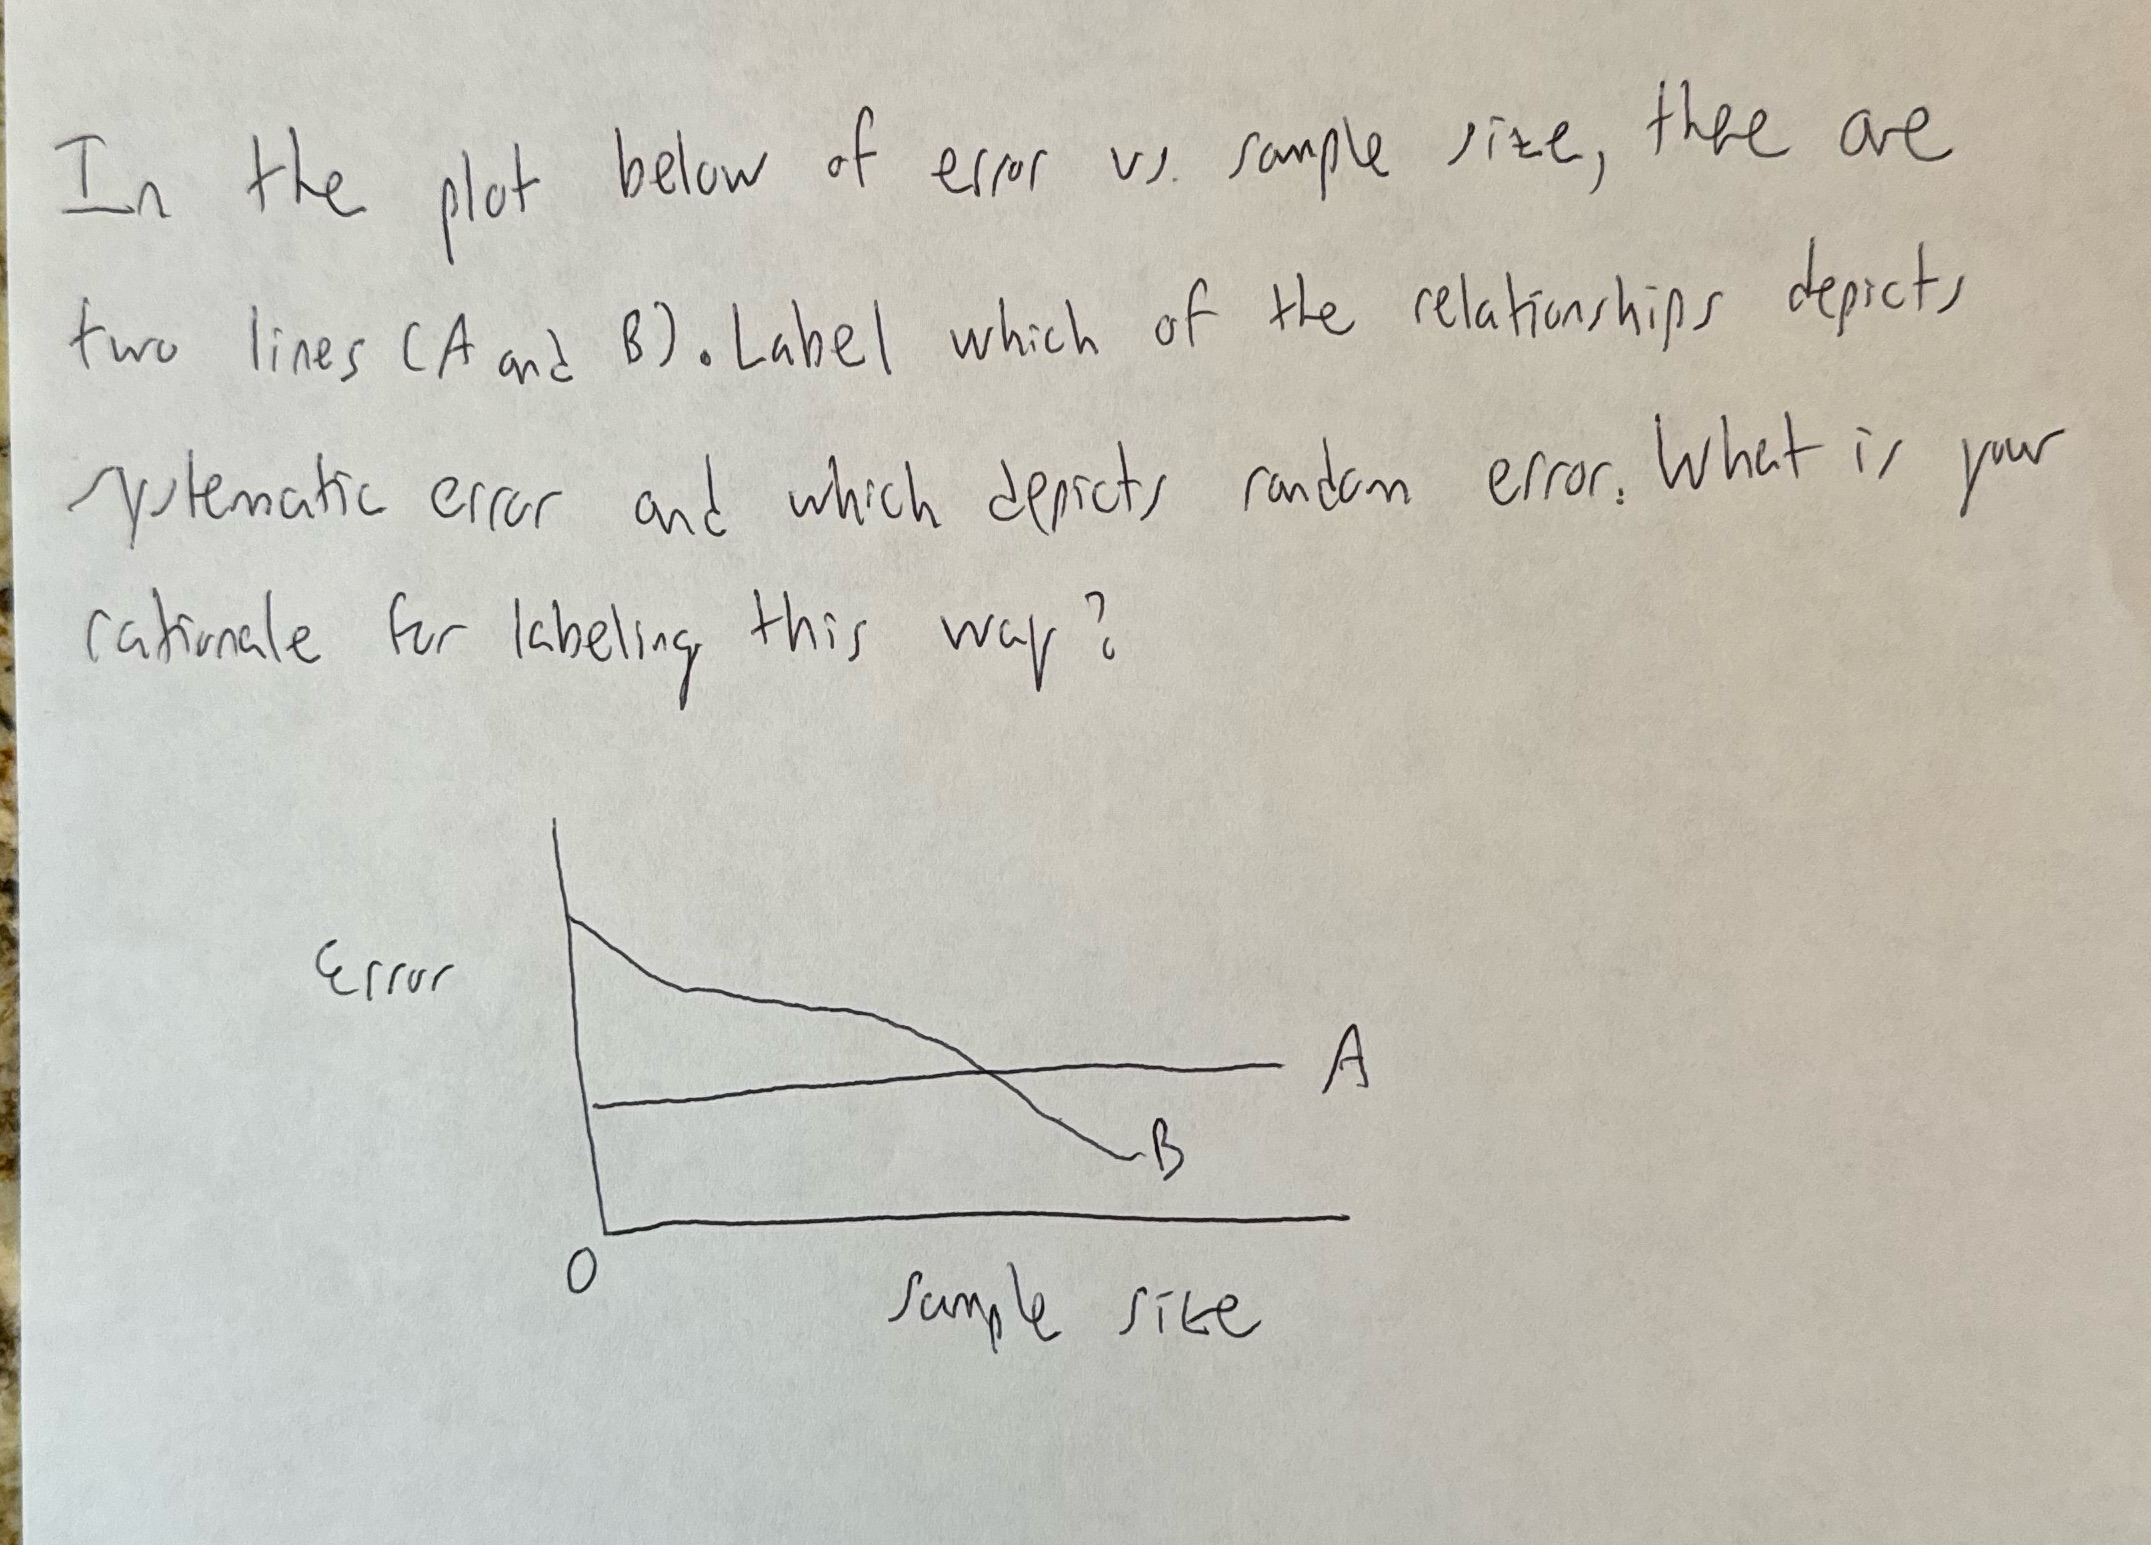
In the plot below of error vs. sample size, there are two lines (A and B). Label which of the relationships depicts your Jutematic error and which depicts random error, What is pur cationale for labeling this way? Error 0 -B sample size A
Step by Step Solution
There are 3 Steps involved in it
1 Expert Approved Answer
Step: 1 Unlock

Question Has Been Solved by an Expert!
Get step-by-step solutions from verified subject matter experts
Step: 2 Unlock
Step: 3 Unlock